


 UBS Projects Mixed Market Outlook for 2025 Amid Trump Policy Uncertainty
  Moldova Criticizes Russia Amid Transdniestria Energy Crisis
  Wall Street Analysts Weigh in on Latest NFP Data
  Bank of America Posts Strong Q4 2024 Results, Shares Rise
  U.S. Banks Report Strong Q4 Profits Amid Investment Banking Surge
  FxWirePro- Major Pair levels and bias summary
  Gold Prices Slide as Rate Cut Prospects Diminish; Copper Gains on China Stimulus Hopes
  FxWirePro: EUR/AUD gaining momentum for a move towards 1.6800 level
  Aussie Retreats Against the Yen: AUDJPY Bears Target 108 as 110 Resistance Holds Firm
  FxWirePro: USD/CAD runs out of steam but maintains bullish outlook
  FxWirePro: GBP/USD recovers but bears are not done yet again
  US Gas Market Poised for Supercycle: Bernstein Analysts
  FxWirePro- Major Crypto levels and bias summary
  Goldman Predicts 50% Odds of 10% U.S. Tariff on Copper by Q1 Close
  Stock Futures Dip as Investors Await Key Payrolls Data
  EUR/JPY Bulls Charge: Eyeing 186.00 as Euro Strength Intensifies
  S&P 500 Relies on Tech for Growth in Q4 2024, Says Barclays


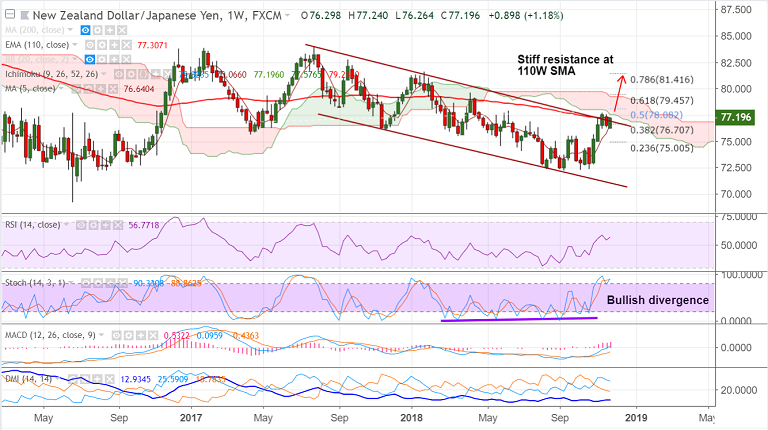
NZD/JPY chart on Trading View used for analysis
- NZD/JPY is attempting breakout of sloping channel pattern.
- The pair has been extending choppy trade at 110-W EMA resistance.
- We are seeing a grind along channel top and breakout there could see bullish continuation.
- A bullish divergence on Stochs on the weekly charts adds to upside scope.
- Breakout at 110-W EMA finds next major resistance at weekly cloud at 77.57.
- On the flipside, 76.64 (5W SMA is immediate support), weakness likely on break below.
Support levels - 76.63 (5W SMA), 75 (23.6% Fib)
Resistance levels - 77.30 (110-W EMA), 77.57 (weekly cloud base), 79.45 (61.8% Fib)
For details on FxWirePro's Currency Strength Index, visit http://www.fxwirepro.com/currencyindex.


