


 Geopolitical Shocks That Could Reshape Financial Markets in 2025
  Pound Under Pressure as Yen Stabilizes: GBPJPY Bears Target 208 as Key EMAs Hold Resistance
  Oil Prices Dip Slightly Amid Focus on Russian Sanctions and U.S. Inflation Data
  European Stocks Rally on Chinese Growth and Mining Merger Speculation
  Goldman Predicts 50% Odds of 10% U.S. Tariff on Copper by Q1 Close
  Lithium Market Poised for Recovery Amid Supply Cuts and Rising Demand
  Bitcoin Battles Volatility: Institutional Support Eyes USD 64,000 Floor Amid Geopolitical Tensions
  US Futures Rise as Investors Eye Earnings, Inflation Data, and Wildfire Impacts
  FxWirePro: USD/CNY gains some ground but bearish outlook persists
  FxWirePro- Major European Indices
  Bank of America Posts Strong Q4 2024 Results, Shares Rise
  FxWirePro: EUR/ NZD consolidating around 2.0180 room for further gains
  FxWirePro: EUR/AUD eases slightly but trend is still bullish
  Moldova Criticizes Russia Amid Transdniestria Energy Crisis
  UBS Predicts Potential Fed Rate Cut Amid Strong US Economic Data
  FxWirePro: USD/ZAR fibo rejection triggers sizeable pullback


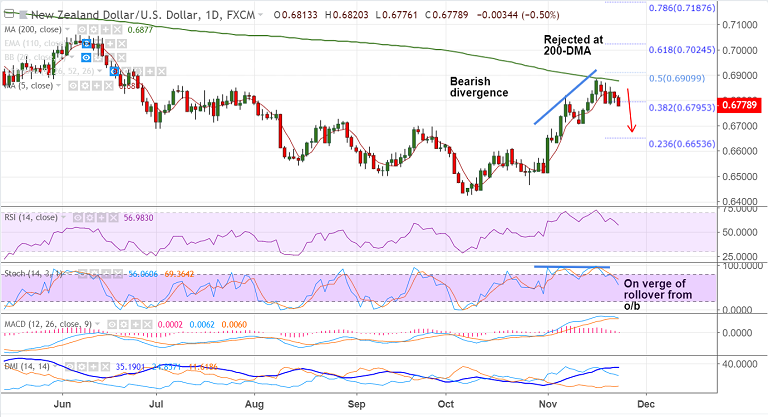
NZD/USD chart on Trading View used for analysis
- NZD/USD slumps lower on broad-based kiwi weakness. Oil weakness weighing on the antipodeans.
- The major is trading 0.49% lower on the day at 0.6779 at the time of writing.
- Price action was rejected at 200-DMA and any bullish continuation only on break above.
- The pair is on track to test 110-EMA at 0.6716. Break below to see further weakness.
- New Zealand quarterly Retail Sales data due for release early Monday session will be in focus for further impetus.
Support levels - 0.6716 (110-EMA), 0.67, 0.6676 (55-EMA)
Resistance levels - 0.6810 (5-DMA), 0.6877 (200-DMA), 0.69
For details on FxWirePro's Currency Strength Index, visit http://www.fxwirepro.com/currencyindex.


