


 NZDJPY Technical Outlook: Bearish Bias Deepens as Key Resistances Hold
  FxWirePro- Woodies Pivot(Major)
  FxWirePro: EUR/ NZD steadies around 2.0150, retains bid tone
  FxWirePro: GBP/USD recovers but bears are not done yet again
  FxWirePro: GBP/USD gains some upside momentum but still bearish
  FxWirePro: USD/JPY neutral in the near-term, scope for downward resumption
  FxWirePro: NZD/USD cautiously bid as traders sense end to Iran war
  Ethereum Rises on Geopolitical De-escalation: Pezeshkian’s Peace Signal Ignites Bullish Momentum
  FxWirePro: EUR/AUD gaining momentum for a move towards 1.6800 level
  FxWirePro- Major Pair levels and bias summary
  FxWirePro: USD/CNY dips as China’s yuan strengthens on Iran war de escalation hopes
  FxWirePro: GBP/NZD uptrend loses momentum but bullish setup remains
  FxWirePro: EUR/AUD retreats slightly but trend is still bullish
  FxWirePro- Major Crypto levels and bias summary
  FxWirePro- Major European Indices
  FxWirePro: USD/ZAR fibo rejection triggers sizeable pullback
  AUDJPY Pullback Intensifies: Resistance at 110.00 Signals Short Opportunity


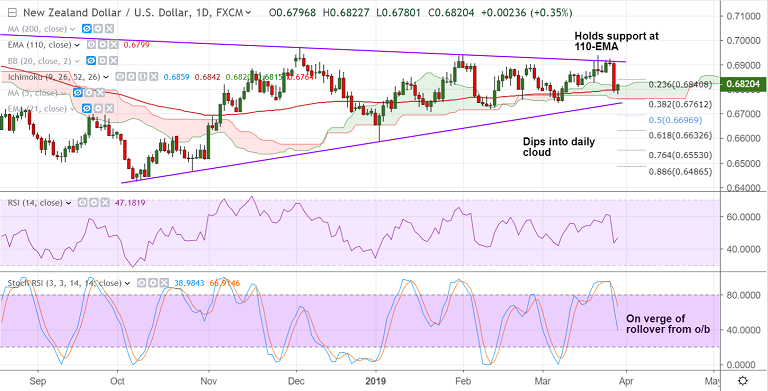
NZD/USD chart - Trading View
- NZD/USD has edged higher from 3-week lows at 0.6780 and is currently trading at 0.6822 at 0530 GMT.
- The pair has held support at 110-EMA and we see weakness only on break below.
- Range trade continues on the weekly charts, upside remains capped below major resistance at 0.6931 (converged 200-W SMA and 110-W EMA).
- On the lower side 21-W EMA is strong support and decisive break below will see major weakness.
- On the daily charts the pair holds support at 110-EMA. Break below eyes cloud support at 0.6764 and then 0.6748 (trendline support).
Support levels - 0.68 (110-EMA), 0.6764 (cloud base), 0.6748 (trendline), 0.6736 (200-DMA)
Resistance levels - 0.6845 (21-EMA), 0.6862 (5-DMA), 0.69
For details on FxWirePro's Currency Strength Index, visit http://www.fxwirepro.com/currencyindex.


