


 AUDJPY Pullback Intensifies: Resistance at 110.00 Signals Short Opportunity
  FxWirePro- Major Pair levels and bias summary
  FxWirePro: USD/JPY neutral in the near-term, scope for downward resumption
  AUDJPY Pullback Intensifies: Resistance at 110.00 Signals Short Opportunity
  FxWirePro- Major Crypto levels and bias summary
  FxWirePro: GBP/USD recovers but bears are not done yet again
  Yen Resurgence Drives GBPJPY to 2.5-Week Low: Sellers Aim for 208.00
  Bitcoin Recovers Amid Easing Geopolitics: Bulls Target USD 80,000 Support Rebound
  FxWirePro: GBP/USD gains some upside momentum but still bearish
  FxWirePro: USD/CNY dips as China’s yuan strengthens on Iran war de escalation hopes
  FxWirePro: GBP/NZD uptrend loses momentum but bullish setup remains
  FxWirePro: USD/ZAR loses momentum but outlook is bullish
  NZDJPY Technical Outlook: Bearish Bias Deepens as Key Resistances Hold
  FxWirePro: EUR/AUD retreats slightly but trend is still bullish
  FxWirePro: USD/ZAR fibo rejection triggers sizeable pullback
  FxWirePro: NZD/USD cautiously bid as traders sense end to Iran war
  FxWirePro- Woodies Pivot(Major)


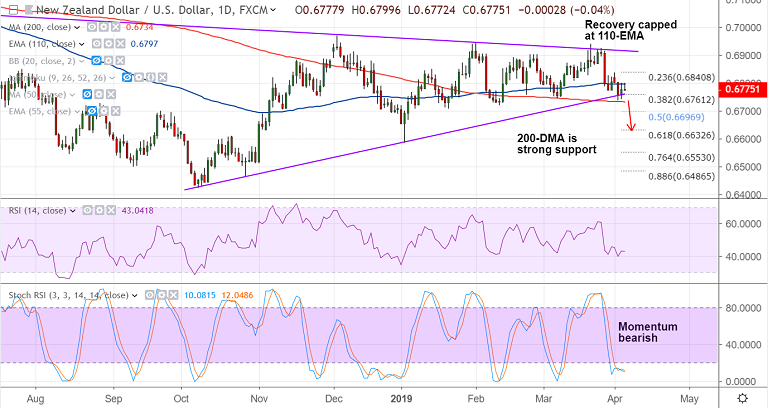
NZD/USD chart - Trading View
Candlestick Pattern: Inverted Hammer
Chart Pattern: Symmetric Triangle
Technical Analysis:
- NZD/USD rejected at 110-EMA resistance
- RSI below 50, bias bearish
- Stochs are at oversold levels, but no signs of reversal evident
- MACD supports weakness, -ve DMI is dominant
Major Support - 0.6761 (38.2% Fib), 0.6734 (200-DMA)
Major Resistance - 0.6797 (110-EMA), 0.6840 (23.6% Fib)
Currency Forecast: Scope for test of 0.6761/ 0.6735
For details on FxWirePro's Currency Strength Index, visit http://www.fxwirepro.com/currencyindex.

- News

- Economy

- Central Banks
- Investing
- Research
- Roundups
- Digital Currency
- Insights
- Technical Analysis
- Technology
- Business
- Law
- Health
- Nature
- Fintech
- Science
- Topic
- Opinions
- ©Econometrics LLC . All Rights Reserved.
FxWirePro: NZD/USD Daily Outlook
Thursday, April 4, 2019 10:05 AM UTC
Editor's Picks


- Market Data
Most Popular


