


 FxWirePro- Major European Indices
  NZDJPY Bulls Charge Toward 95.00: Safe-Haven Exodus Drives Kiwi Rally
  FxWirePro: USD/CNY neutral in the near-term, scope for downward resumption
  FxWirePro- Major Crypto levels and bias summary
  FxWirePro: USD/JPY holding bid into weekend
  FxWirePro: GBP/NZD down trend loses steam, remains on bearish path
  FxWirePro: GBP/NZD up trend gains some momentum but hurdles ahead
  Ethereum Consolidates: Bullish Technicals Point to a Potential $3,000 Breakout
  FxWirePro: EUR/AUD under pressure as key support gives way
  FxWirePro: EUR/CAD gains ground on prospects of resumed energy flows
  FxWirePro: USD/ZAR recovers slightly but trend is still bearish
  Euro Holds the Line: EURUSD Finds Support at the 365-EMA as Peace Talks Loom
  FxWirePro- Woodies Pivot(Major)
  FxWirePro: USD/ZAR edges lower ,investors remain on edge
  FxWirePro:NZD/USD uptrend loses momentum but bullish setup remains


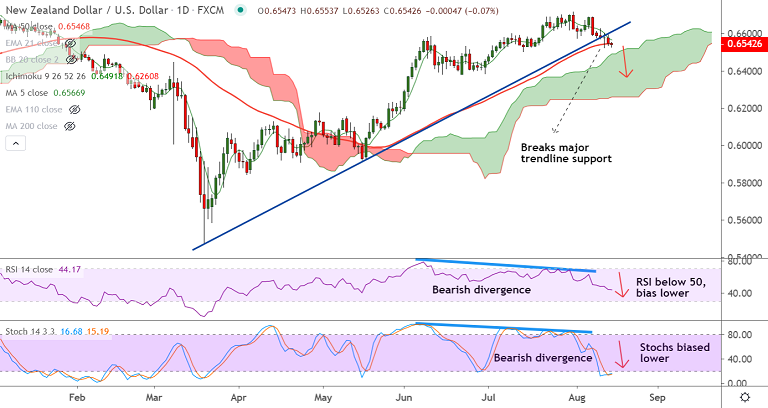
NZD/USD chart - Trading View
NZD/USD was trading 0.16% lower on the day at 0.6536 at around 05:55 GMT.
The pair is extending downside after a dovish RBNZ on Wednesday dented the kiwi across the board.
Price action has broken below major trendline 50-DMA support and further weakness on charts.
Oscillators are biased lower and a bearish divergence on RSI and Stochastics on the daily charts adds to the downside bias.
Dip till daily cloud likely. Major trend is neutral to slightly bullish. Further weakness only on break into cloud. Bullish invalidation below 200-DMA.
Support levels - 0.6506 (55-EMA), 0.6491 (Cloud top)
Resistance levels - 0.6567 (5-DMA), 0.6592 (21-EMA)


