


 FxWirePro:NZD/USD drifts lower, could be on verge of bigger drop
  FxWirePro- Woodies Pivot(Major)
  Euro Retreats as Geopolitical Tensions Surge: EURUSD Eyes 1.1400 Floor Amid Safe-Haven Demand
  FxWirePro: GBP/NZD remains buoyant, looks to extend gains
  FxWirePro: USD/ZAR fibo rejection triggers sizeable pullback
  FxWirePro- Major European Indices
  FxWirePro: EUR/ NZD steadies around 2.0150, retains bid tone
  Pound Under Pressure as Yen Stabilizes: GBPJPY Bears Target 208 as Key EMAs Hold Resistance
  FxWirePro: AUD/USD downside pressure builds, key support level in focus
  FxWirePro- Major Crypto levels and bias summary
  FxWirePro- Major Pair levels and bias summary
  FxWirePro: EUR/ NZD consolidating around 2.0180 room for further gains
  FxWirePro: GBP/USD recovers but bears are not done yet again
  Ethereum Retreats Toward USD 2,000: Technicals Signal Caution as ETH Mimics Bitcoin’s Pullback
  FxWirePro: GBP/USD outlook weaker on renewed downside pressure
  FxWirePro: USD/CAD runs out of steam but maintains bullish outlook


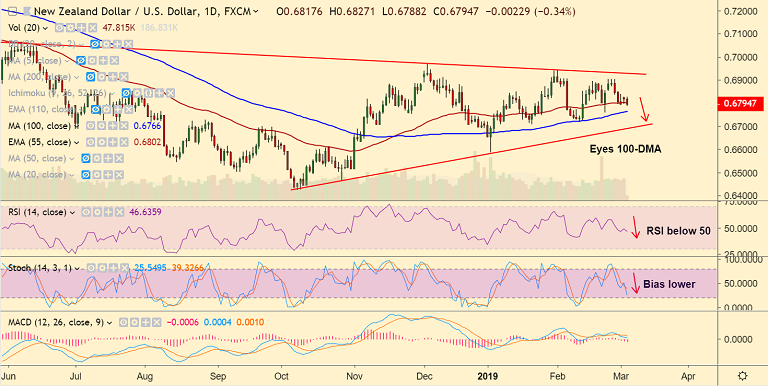
NZD/USD chart - Trading View
- NZD/USD trades at 0.6794 at 0455 GMT, down 0.33% at the time of writing.
- The pair has slipped below 55-EMA and technical indicators support further weakness.
- Negative news out of China weighs on the antipodeans, keeping downside pressure.
- China services purchasing managers’ index (PMI) for February came in at 51.1, missing the estimate of a rise to 53.8 from the previous month’s print of 53.6.
- Further, China revised lower the gross domestic product (GDP) estimate to 6.0–6.5% range for 2019.
- Sentiment based on the US-China trade deal developments will continue to affect price movements.
- Break below 55-EMA has raised scope for dip till 100-DMA at 0.6766. Further weakness eyes 200-DMA at 0.6748.
- On the flipside, we see strong resistance at 0.6714 (nearly converged 5 and 20-DMA). Retrace above 20-DMA could see further upside.
Support levels - 0.6766 (100-DMA), 0.6748 (200-DMA)
Resistance levels - 0.6814 (nearly converged 5 and 20-DMA), 0.6848 (Jan 15 high)
For details on FxWirePro's Currency Strength Index, visit http://www.fxwirepro.com/currencyindex.


