


 FxWirePro:NZD/USD uptrend loses momentum but bullish setup remains
  FxWirePro: USD/JPY holding bid into weekend
  FxWirePro: USD/CNY neutral in the near-term, scope for downward resumption
  Ethereum’s Healthy Correction: Bulls Eye Strategic Re-Entry at 2,150 USD Following Profit-Booking Pullback
  FxWirePro: GBP/USD bulls remain cautiously optimistic
  FxWirePro: USD/ZAR edges lower ,investors remain on edge
  Bitcoin’s Islamabad Watch: BTCUSD Consolidates Near 71,421 USD as Geopolitical Peace Talks Loom
  Aussie Consolidates After Peak: AUDJPY Bulls Eye a Strategic Entry for the 115.00 Target
  Ethereum Consolidates: Bullish Technicals Point to a Potential $3,000 Breakout
  FxWirePro:NZD/USD continues to recovers , upside pressure builds
  FxWirePro: USD/CAD extends decline on broad dollar weakness
  Pound on Pause: GBPJPY Bulls Regroup for a Potential Sprint Toward 215.00
  FxWirePro: EUR/CAD gains ground on prospects of resumed energy flows
  FxWirePro: AUD/USD retreats slightly but trend is still bullish
  FxWirePro- Woodies Pivot(Major)
  FxWirePro- Major Crypto levels and bias summary


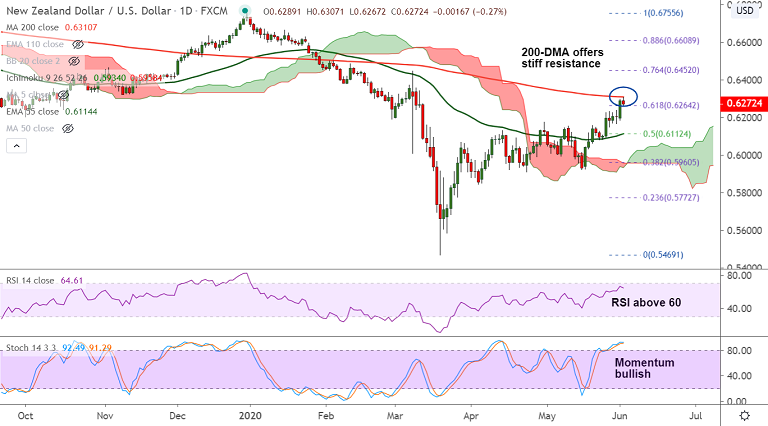
NZD/USD chart - Trading View
NZD/USD was trading 0.34% lower on the day at 0.6267 at around 07:00 GMT, after closing 1.36% higher in the previous session.
The pair tested 0.63 handle before paring some gains. Stiff resistance is seen at 200-DMA at 0.6310.
Technical indicators are bullishly aligned and support upside in the pair. Break above 200-DMA will confirm further gains.
Ongoing US-China trade concerns and escalating civil unrest in the US keep the US dollar undermined.
No major data releases scheduled for the day. Focus remains on New Zealand GDT price index for impetus.
Decisive breakout at 200-DMA finds next major hurdle at 55W EMA at 0.6356. Above 55W EMA, the pair finds little resistance till 0.6452 (76.4% Fib).
On the flipside, failure to break above 200-DMA and retrace below 110-EMA will negate upside bias.
Support levels - 0.6264 (61.8% Fib), 0.6231 (5-DMA), 0.6187 (110-EMA)
Resistance levels - 0.6310 (200-DMA), 0.6356 (55W EMA), 0.6452 (76.4% Fib), 0.6545 (110-EMA)


