


 NZDJPY Technical Outlook: Bearish Bias Deepens as Key Resistances Hold
  FxWirePro: NZD/USD cautiously bid as traders sense end to Iran war
  FxWirePro: GBP/USD gains some upside momentum but still bearish
  FxWirePro- Major Crypto levels and bias summary
  FxWirePro: USD/CNY dips as China’s yuan strengthens on Iran war de escalation hopes
  FxWirePro- Major European Indices
  FxWirePro: GBP/USD recovers but bears are not done yet again
  EUR/JPY Bulls Charge: Eyeing 186.00 as Euro Strength Intensifies
  FxWirePro: GBP/NZD uptrend loses momentum but bullish setup remains
  AUDJPY Pullback Intensifies: Resistance at 110.00 Signals Short Opportunity
  FxWirePro: EUR/ NZD loses momentum but outlook is bullish
  FxWirePro: EUR/AUD retreats slightly but trend is still bullish
  AUDJPY Pullback Intensifies: Resistance at 110.00 Signals Short Opportunity
  FxWirePro- Major Pair levels and bias summary
  Ethereum Rises on Geopolitical De-escalation: Pezeshkian’s Peace Signal Ignites Bullish Momentum
  FxWirePro: EUR/AUD gaining momentum for a move towards 1.6800 level


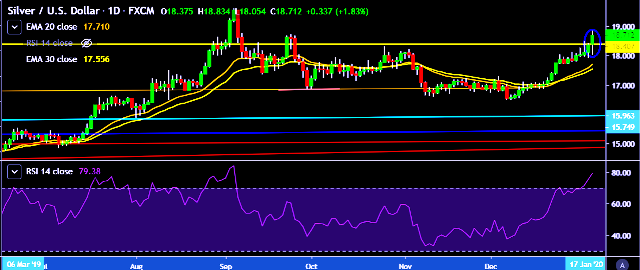
- XAG/USD is currently trading around $18.67 marks.
- It made intraday high at $18.83 and low at $18.54 levels.
- Intraday bias remains bullish for the moment.
- A daily close above $18.37 will test key resistances at $18.87, $18.98, $19.08 and $19.24 marks respectively.
- On the other side, a daily close below $18.37 will take the parity down towards key supports at $18.10, $17.92, $17.74, $17.62, $17.35 and $17.17 marks respectively.
- Important to note here that 20D, 30D and 55D EMA heads up and confirms the bullish trend in a daily chart.
We prefer to take long position on XAG/USD around $18.65, stop loss at $18.47 and target of $18.87/$19.08.


