


 FxWirePro: GBP/AUD downtrend extends, eyes 1.8900 evel
  Bitcoin Breaks the $70,000 Barrier: Bulls Target the $80,000 Horizon as Geopolitical Relief Ignites Crypto Markets
  FxWirePro- Woodies Pivot(Major)
  FxWirePro: GBP/USD stuck in range but maintains bearish bias
  FxWirePro: EUR/ NZD downside pressure builds, key support level in focus
  FxWirePro: GBP/USD climbs to 4 -week high as ceasefire deal gives bulls traction
  FxWirePro- Major Pair levels and bias summary
  FxWirePro- Major Crypto levels and bias summary
  FxWirePro: USD/ZAR slips sharply lower as US-Iran ceasefire lifts risk appetite
  EUR/JPY Breaks Out: Euro Surges Past 185.00 Resistance Amid Strong Bullish Momentum
  Aussie Bulls Charge: AUD/JPY Rallies as Geopolitical Clouds Part
  NZD/JPY Rockets as Kiwi Dollar Resilience Defies the Oil Shock
  FxWirePro: USD/ JPY slips as yen rallies after Mideast ceasefire declaration
  FxWirePro- Major Pair levels and bias summary
  Ethereum Reclaims Higher Ground: Ether Bulls Target $2,700 as Middle East Tensions Thaw


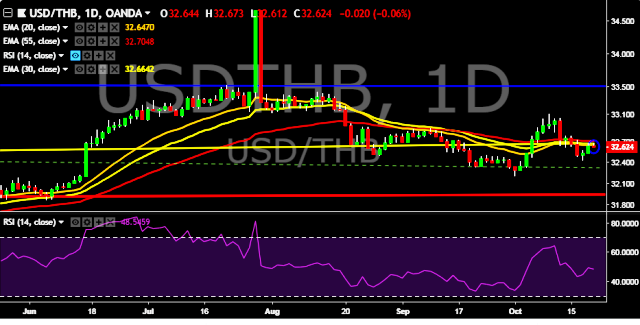
- USD/THB is currently trading around 32.61 marks.
- It made intraday high at 32.67 and low at 32.61 marks.
- Intraday bias remains neutral for the moment.
- On the top side, key resistances are seen at 32.65, 32.90, 33.05, 33.20, 33.37, 33.52, 33.78 and 33.96 marks respectively.
- Alternatively, a daily close below 32.65 will drag the parity down towards key supports around 32.42, 32.27, 32.18, 32.02 and 31.85 marks respectively.
- Important to note here that 20D, 30D and 55D EMA heads down and confirms the bearish trend in a daily chart.
Positioning is inconclusive at this point, with prices offering no clear cut signal to initiate a long or short trade. We will continue to remain on sidelines for the time being.


