


 Euro Retreats as Geopolitical Tensions Surge: EURUSD Eyes 1.1400 Floor Amid Safe-Haven Demand
  Bitcoin Battles Volatility: Institutional Support Eyes USD 64,000 Floor Amid Geopolitical Tensions
  Ethereum Retreats Toward USD 2,000: Technicals Signal Caution as ETH Mimics Bitcoin’s Pullback
  FxWirePro: GBP/USD outlook weaker on renewed downside pressure
  FxWirePro: AUD/USD downside pressure builds, key support level in focus
  FxWirePro: USD/CNY gains some ground but bearish outlook persists
  FxWirePro: EUR/AUD gaining momentum for a move towards 1.6800 level
  FxWirePro: EUR/ NZD consolidating around 2.0180 room for further gains
  FxWirePro: GBP/USD recovers but bears are not done yet again
  FxWirePro: USD/CAD runs out of steam but maintains bullish outlook
  NZDJPY Bears Take Control: New Zealand Dollar Retreats as 92 Resistance Holds Firm
  FxWirePro- Woodies Pivot(Major)
  FxWirePro- Major Crypto levels and bias summary
  FxWirePro- Major European Indices
  FxWirePro: EUR/ NZD steadies around 2.0150, retains bid tone


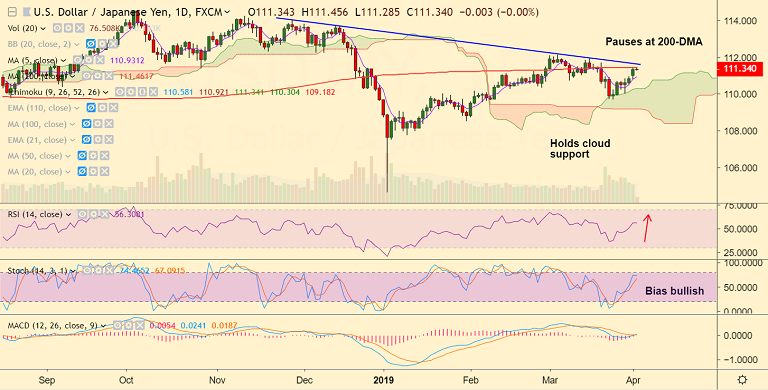
USD/JPY chart - Trading View
- USD/JPY pauses gains at 200-DMA at 111.46, break above required for further upside.
- The major is trading in an extremely narrow range, with session highs at 111.45 and lows at 111.28.
- Technical studies support upside. Stochs and RSI are biased higher. MACD is on verge of bullish crossover on signal line.
- The pair has bounced off cloud support and breakout at 200-DMA eyes 76.4% Fib at 112.21.
- Immediate support lies at 5-DMA at 110.93. Break below cloud to see further downside.
Support levels - 111, 110.93 (5-DMA), 110.30 (cloud top)
Resistance levels - 111.46 (200-DMA), 111.60 (trendline), 112.21 (76.4% Fib)
For details on FxWirePro's Currency Strength Index, visit http://www.fxwirepro.com/currencyindex.


