


 FxWirePro: GBP/USD outlook weaker on renewed downside pressure
  FxWirePro: USD/CNY gains some ground but bearish outlook persists
  FxWirePro- Major European Indices
  FxWirePro: GBP/NZD range to extend until there is game changing news
  FxWirePro: AUD/USD downside pressure builds, key support level in focus
  Pound Under Pressure as Yen Stabilizes: GBPJPY Bears Target 208 as Key EMAs Hold Resistance
  FxWirePro:NZD/USD drifts lower, could be on verge of bigger drop
  EUR/JPY Bulls Charge: Eyeing 186.00 as Euro Strength Intensifies
  FxWirePro- Major Pair levels and bias summary
  FxWirePro- Woodies Pivot(Major)
  Bitcoin Battles Volatility: Institutional Support Eyes USD 64,000 Floor Amid Geopolitical Tensions
  FxWirePro: USD/JPY firms as Trump's address on Gulf war spark fresh concerns
  Aussie Retreats Against the Yen: AUDJPY Bears Target 108 as 110 Resistance Holds Firm
  Euro Retreats as Geopolitical Tensions Surge: EURUSD Eyes 1.1400 Floor Amid Safe-Haven Demand
  FxWirePro: EUR/AUD gaining momentum for a move towards 1.6800 level
  FxWirePro: USD/ZAR sustains gains as uptrend remains strong
  FxWirePro- Major Pair levels and bias summary


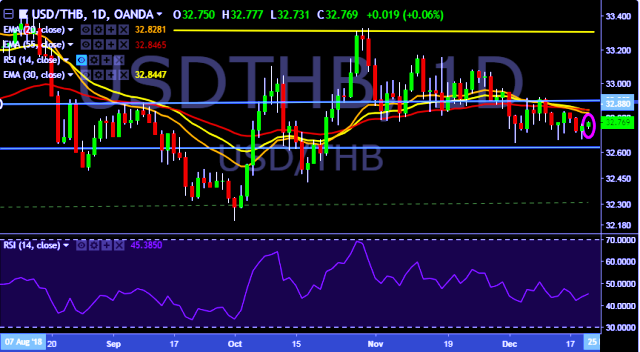
- USD/THB is currently trading around 32.77 marks.
- It made intraday high at 32.77 and low at 32.73 marks.
- Intraday bias remains bullish till the time pair holds immediate support at 32.67 mark.
- On the top side, key resistances are seen at 32.83, 32.92, 33.07, 33.15, 33.32 and 33.52 marks respectively.
- Alternatively, a daily close below 32.72 will drag the parity down towards key supports around 32.65, 32.57, 32.42, 32.20 and 32.07 marks respectively.
- Important to note here that 20D, 30D and 55D EMA heads down and confirms the bearish trend in a daily chart.Current upside movement is short term trend correction only.
We prefer to take long position on USD/THB around 32.75, stop loss at 32.67 and target of 32.83/32.92.


