


 FxWirePro: USD/ZAR continues to recovers , upside pressure builds
  FxWirePro: AUD/USD spikes as Trump announces two-week Iran ceasefire
  FxWirePro- Major Pair levels and bias summary
  FxWirePro- Major Crypto levels and bias summary
  FxWirePro- Woodies Pivot(Major)
  FxWirePro: USD/ZAR slips sharply lower as US-Iran ceasefire lifts risk appetite
  Euro Ascendant: EUR/USD Breaks $1.17 as Geopolitical Relief Sparks a Bullish Surge
  FxWirePro: USD/CNY falls to three-year high, scope for further downside
  FxWirePro:NZD/USD jumps as RBNZ warns of higher OCR potential
  FxWirePro: GBP/NZD reverses course, bias back to downside
  Aussie Bulls Charge: AUD/JPY Rallies as Geopolitical Clouds Part
  Ethereum Braces for Volatility: Technicals Turn Bearish as Geopolitical Tensions Loom
  FxWirePro: GBP/AUD downtrend extends, eyes 1.8900 evel
  NZD/JPY Rockets as Kiwi Dollar Resilience Defies the Oil Shock
  FxWirePro: GBP/USD climbs to 4 -week high as ceasefire deal gives bulls traction
  FxWirePro: EUR/ NZD downside pressure builds, key support level in focus


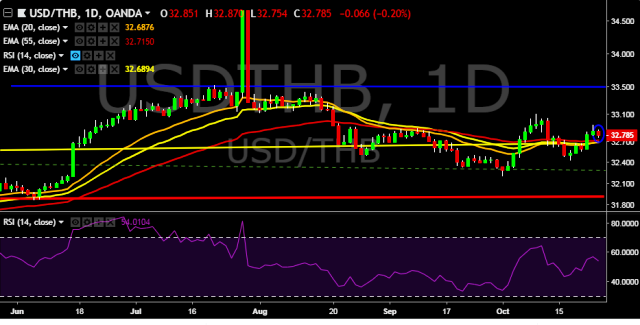
- USD/THB is currently trading around 32.77 marks.
- It made intraday high at 32.87 and low at 32.75 marks.
- Intraday bias remains slightly bearish for the moment.
- On the top side, key resistances are seen at 32.90, 33.05, 33.20, 33.37, 33.52, 33.78 and 33.96 marks respectively.
- Alternatively, a daily close below 32.85 will drag the parity down towards key supports around 32.57, 32.42, 32.27, 32.18, 32.02 and 31.85 marks respectively.
- Important to note here that 20D, 30D and 55D EMA heads down and confirms the bearish trend in a daily chart.
We prefer to take short position on USD/THB only below 32.70, stop loss 32.95 and target of 32.42.


