


 NZDJPY Technical Outlook: Bearish Bias Deepens as Key Resistances Hold
  EUR/JPY Bulls Charge: Eyeing 186.00 as Euro Strength Intensifies
  FxWirePro- Woodies Pivot(Major)
  FxWirePro: GBP/NZD uptrend loses momentum but bullish setup remains
  FxWirePro: USD/ZAR fibo rejection triggers sizeable pullback
  FxWirePro: AUD/USD gains some ground but remains sensitive to Middle East tensions
  AUDJPY Pullback Intensifies: Resistance at 110.00 Signals Short Opportunity
  FxWirePro: EUR/AUD retreats slightly but trend is still bullish
  FxWirePro: USD/CNY dips as China’s yuan strengthens on Iran war de escalation hopes
  Bitcoin Recovers Amid Easing Geopolitics: Bulls Target USD 80,000 Support Rebound
  FxWirePro: EUR/ NZD loses momentum but outlook is bullish
  FxWirePro: USD/JPY neutral in the near-term, scope for downward resumption
  FxWirePro: NZD/USD cautiously bid as traders sense end to Iran war
  FxWirePro- Major Pair levels and bias summary
  Ethereum Rises on Geopolitical De-escalation: Pezeshkian’s Peace Signal Ignites Bullish Momentum


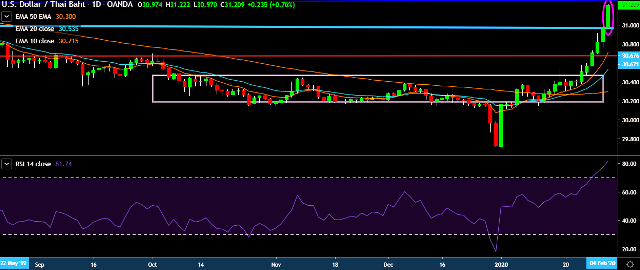
- USD/THB is currently trading around 31.25 marks.
- It made intraday high at 31.26 and low at 30.97 marks.
- Intraday bias remains bullish for the moment.
- On the top side, key resistances are seen at 31.50, 31.70 and 31.92 marks respectively.
- Alternatively, a daily close below 30.97 will drag the parity down towards key supports around 30.70, 30.56, 30.37, 30.15, 29.96 and 29.72 marks respectively.
- Important to note here that 20D, 30D and 55D EMA heads up and confirms the bullish trend in a daily chart.
We prefer to go long on USD/THB around 31.15, stop loss at 30.95 and target of 31.50/31.70.


