


 AUDJPY Pullback Intensifies: Resistance at 110.00 Signals Short Opportunity
  NZDJPY Technical Outlook: Bearish Bias Deepens as Key Resistances Hold
  Bitcoin on Edge: Geopolitical Tensions Weigh on BTC as Bulls Eye the USD 64,000 "Buy the Dip" Zone
  FxWirePro: USD/JPY neutral in the near-term, scope for downward resumption
  Yen Resurgence Drives GBPJPY to 2.5-Week Low: Sellers Aim for 208.00
  Bitcoin Recovers Amid Easing Geopolitics: Bulls Target USD 80,000 Support Rebound
  FxWirePro: GBP/AUD runs out of steam but maintains bullish outlook
  FxWirePro: NZD/USD cautiously bid as traders sense end to Iran war
  FxWirePro- Woodies Pivot(Major)
  AUDJPY Pullback Intensifies: Resistance at 110.00 Signals Short Opportunity
  FxWirePro: GBP/USD gains some upside momentum but still bearish
  FxWirePro- Major European Indices
  Euro Bulls Retreat: EURUSD Faces Resistance at 1.1500 as Technical Indicators Signal Further Downside
  FxWirePro: AUD/USD gains some ground but remains sensitive to Middle East tensions
  Sterling’s Six-Week Streak Snaps: GBPJPY Slumps Toward 210.00 as Bearish Momentum Intensifies


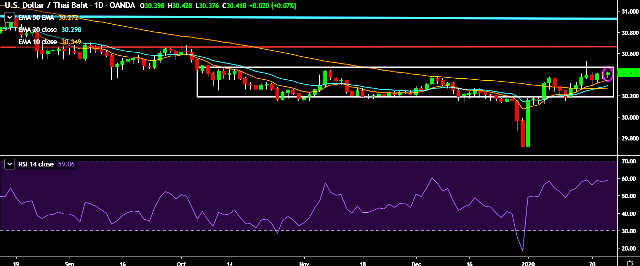
- USD/THB is currently trading around 30.41 marks.
- It made intraday high at 30.42 and low at 30.37 marks.
- Intraday bias remains neutral for the moment.
- On the top side, key resistances are seen at 30.52, 30.70, 30.97, 31.20, 31.50 and 31.70 marks respectively.
- Alternatively, a daily close below 30.35 will drag the parity down towards key supports around 30.15, 29.96, 29.72, 29.55, 29.25 and 28.56 marks respectively.
- Important to note here that 20D, 30D and 55D EMA heads up and confirms the bullish trend in a daily chart.
We prefer to go long on USD/THB only above 30.42, stop loss at 30.30 and target of 30.72.


