


 Ethereum Retreats Toward USD 2,000: Technicals Signal Caution as ETH Mimics Bitcoin’s Pullback
  Bitcoin Battles Volatility: Institutional Support Eyes USD 64,000 Floor Amid Geopolitical Tensions
  FxWirePro- Major Pair levels and bias summary
  FxWirePro- Major Crypto levels and bias summary
  FxWirePro: GBP/NZD range to extend until there is game changing news
  FxWirePro: AUD/USD downside pressure builds, key support level in focus
  FxWirePro: GBP/NZD remains buoyant, looks to extend gains
  FxWirePro- Woodies Pivot(Major)
  Pound Under Pressure as Yen Stabilizes: GBPJPY Bears Target 208 as Key EMAs Hold Resistance
  NZDJPY Bears Take Control: New Zealand Dollar Retreats as 92 Resistance Holds Firm
  FxWirePro: GBP/USD recovers but bears are not done yet again
  FxWirePro: EUR/AUD eases slightly but trend is still bullish
  Aussie Retreats Against the Yen: AUDJPY Bears Target 108 as 110 Resistance Holds Firm
  FxWirePro: USD/CNY gains some ground but bearish outlook persists
  FxWirePro- Major Pair levels and bias summary


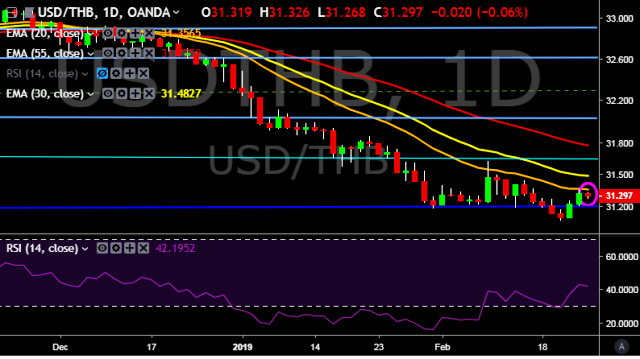
- USD/THB is currently trading around 31.30 marks.
- It made intraday high at 31.33 and low at 31.26 marks.
- Intraday bias remains bullish till the time pair holds key support at 31.20 mark.
- On the top side, key resistances are seen at 31.30, 31.44, 31.62, 31.70, 31.93, 32.02 and 32.10 marks respectively.
- Alternatively, a daily close below 31.22 will drag the parity down towards key supports around 31.10, 30.94, 30.20 and 29.66 marks respectively.
- Important to note here that 20D, 30D and 55D EMA heads down and confirms the bearish trend in a daily chart. Current upside movement is short term trend correction only.
We prefer to take long position on USD/THB only above 31.35, stop loss at 31.20 and target of 31.44/31.62 mark.


