


 FxWirePro:NZD/USD jumps as RBNZ warns of higher OCR potential
  FxWirePro- Woodies Pivot(Major)
  FxWirePro: EUR/AUD falls below 1.6600 level, plunge to test a key fibo grows
  NZDJPY Bearish Breakdown: Why Selling the Rallies is the Strategic Play
  FxWirePro: USD/JPY edges up as yen dips after soft household spending data
  FxWirePro: GBP/NZD reverses course, bias back to downside
  FxWirePro: AUD/USD spikes as Trump announces two-week Iran ceasefire
  FxWirePro- Major Pair levels and bias summary
  FxWirePro: GBP/USD stuck in range but maintains bearish bias
  FxWirePro: USD/CNY falls to three-year high, scope for further downside
  Pound Sterling Power: GBP/JPY Secures Third Day of Gains as Global Risk Tensions Recede
  FxWirePro: GBP/AUD downtrend extends, eyes 1.8900 evel
  FxWirePro- Woodies Pivot(Major)
  FxWirePro: USD/ JPY slips as yen rallies after Mideast ceasefire declaration
  GBPJPY Surges to 211.88: Sterling Bulls Target 215 Amid Broad-Based Buying
  NZD/JPY Rockets as Kiwi Dollar Resilience Defies the Oil Shock


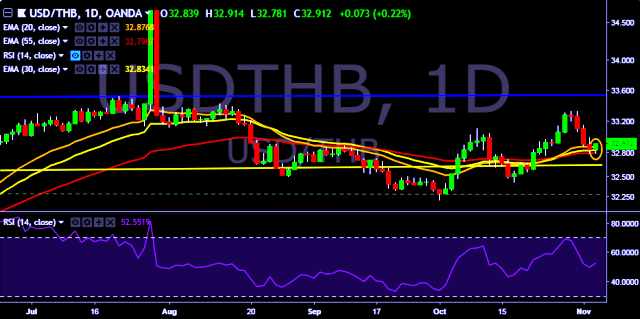
- USD/THB is currently trading around 32.90 marks.
- It made intraday high at 32.91 and low at 32.78 marks.
- Intraday bias remains bullish till the time pair holds key support at 32.70 mark.
- On the top side, key resistances are seen at 33.02, 33.15, 33.32, 33.52, 33.78 and 33.96 marks respectively.
- Alternatively, a daily close below 32.83 will drag the parity down towards key supports around 32.77, 32.57 and 32.42 marks respectively.
- Important to note here that 20D, 30D and 55D EMA heads up and confirms the bullish trend in a daily chart.
We prefer to take long position on USD/THB around 32.88, stop loss 32.77 and target of 33.02/33.15.


