


 FxWirePro: AUD/USD retreats slightly but trend is still bullish
  FxWirePro- Woodies Pivot(Major)
  FxWirePro: USD/CNY neutral in the near-term, scope for downward resumption
  Kiwi Ascendant: NZDJPY Bulls Eye Multi-Year Peaks Amid Triple-Day Rally
  FxWirePro- Major Crypto levels and bias summary
  FxWirePro- Major Pair levels and bias summary
  FxWirePro: EUR/NZD remains under pressure as key support gives way
  FxWirePro: USD/ZAR edges lower ,investors remain on edge
  FxWirePro: USD/CAD extends decline on broad dollar weakness
  FxWirePro: GBP/AUD takes back some lost ground
  FxWirePro: EUR/AUD claws back some losses but rcovery likely muted
  FxWirePro: USD/JPY steadies around 158.75, bias bullish
  Ethereum’s Healthy Correction: Bulls Eye Strategic Re-Entry at 2,150 USD Following Profit-Booking Pullback
  FxWirePro: EUR/AUD under pressure as key support gives way
  NZDJPY Bulls Charge Toward 95.00: Safe-Haven Exodus Drives Kiwi Rally


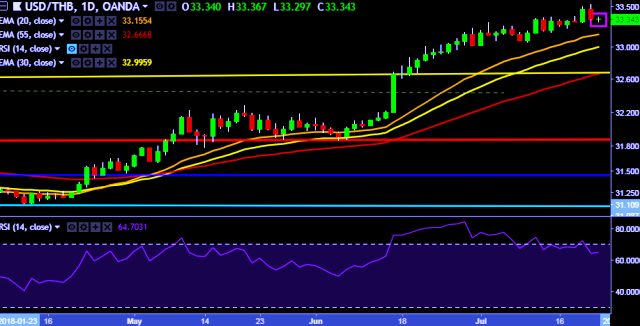
- USD/THB is currently trading around 33.34 marks.
- It made intraday high at 33.36 and low at 33.29 marks.
- Intraday bias remains neutral for the moment.
- On the top side, key resistances are seen at 33.52, 33.78 and 33.96 marks respectively.
- Alternatively, a daily close below 33.34 will drag the parity down towards key supports around 33.22, 33.02, 32.90, 32.66 and 32.50 marks respectively.
- Important to note here that 20D, 30D and 55D EMA heads up and confirms the bullish trend in a daily chart. Current downside movement is short term trend correction only.
Positioning is inconclusive at this point, with prices offering no clear cut signal to initiate a long or short trade. We will continue to remain on sidelines for the time being.


