


 FxWirePro: GBP/USD outlook weaker on renewed downside pressure
  FxWirePro: EUR/AUD eases slightly but trend is still bullish
  Ethereum Retreats Toward USD 2,000: Technicals Signal Caution as ETH Mimics Bitcoin’s Pullback
  FxWirePro:NZD/USD drifts lower, could be on verge of bigger drop
  FxWirePro: EUR/AUD gaining momentum for a move towards 1.6800 level
  FxWirePro: USD/CAD runs out of steam but maintains bullish outlook
  FxWirePro- Woodies Pivot(Major)
  FxWirePro- Major Pair levels and bias summary
  Aussie Retreats Against the Yen: AUDJPY Bears Target 108 as 110 Resistance Holds Firm
  EUR/JPY Bulls Charge: Eyeing 186.00 as Euro Strength Intensifies
  NZDJPY Bears Take Control: New Zealand Dollar Retreats as 92 Resistance Holds Firm
  FxWirePro: USD/ZAR fibo rejection triggers sizeable pullback
  FxWirePro: EUR/ NZD consolidating around 2.0180 room for further gains
  FxWirePro- Major European Indices
  FxWirePro: EUR/ NZD steadies around 2.0150, retains bid tone


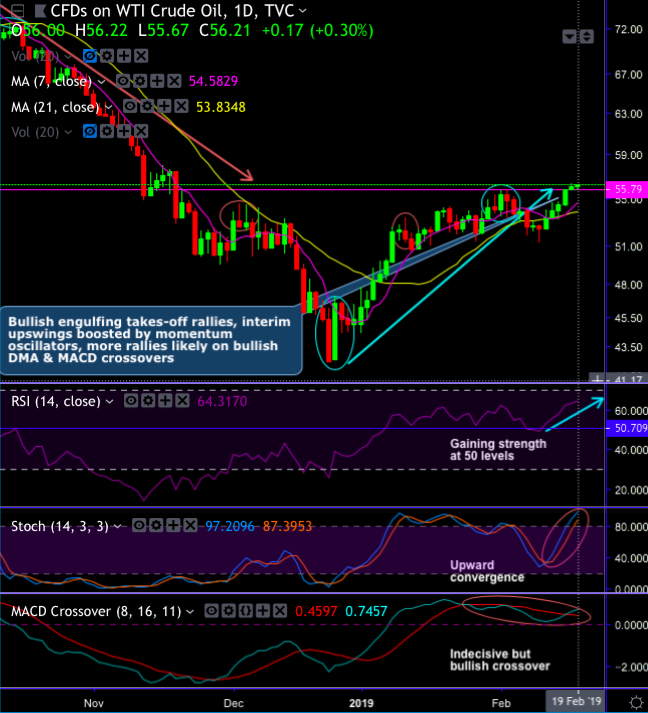
Technical and Candlestick Patterns: WTI crude prices have been spiking higher in the recent past to hit 3-months’ highs.
Bullish engulfing takes-off rallies, interim upswings boosted by momentum oscillators, more rallies likely on bullish DMA & MACD crossovers (refer daily chart). Both leading oscillators (RSI and Stochastic curves) are showing upward convergence to the prevailing rallies to indicate intensified buying momentum.
On a medium-term perspective, sharp rallies have been observed after bottoming out at $42.40 levels. The interim upswings for now, likely to drag further but to restrain below 7EMAs.
Nevertheless, the major downtrend continuation also seems to be on cards as both technical indicators signal weakness. The consolidation phase took place upon hammer & dragonfly doji formations at $33.73 and $33.87 levels but 3-black crow pattern has occurred at $45.40 levels to counter with steep slumps below EMAs (refer monthly chart).
Overall, one could foresee topsy-turvy swings the major trend of this energy commodity in 2019.
Demand/Supply Equation: The production monthly report published last week reported an increase in US crude production by 1.8mbd YoY and 345kbd MoM. While the yearly growth remains high, it has definitely started to slow down since its highs noted in Aug'18. On a monthly basis, we underestimated the month-on-month growth in our own models as we did not factor in such a rapid return for the GoM crude post the Hurricane Michael shutdown.
Despite the strong monthly crude production growth numbers printed, we think US production growth and even absolute levels will stabilize to reflect a slowdown in completions activity, stabilization in productivity gains, higher declines from 2017-2018 vintage wells that contributed disproportionately to 2018 production growth, the impact of lower oil prices on production growth from private operators, and seasonality.
Trading Recommendations: Contemplating above both technical and fundamental rationale, anybody on this planet can guess this rationale that when supply decreases with the increasing demand is forecasted, then the price of the commodity tends to shoot up. Hence, we’ve already advocated initiating longs in NYMEX WTI June 2019 and short NYMEX WTI December 2019 spread on hedging grounds at - $1.19/bbl in the recent past, with the target of +$2/bbl and stop loss of -$2/bbl. Courtesy: TradingView.com and JPM
Currency Strength Index: FxWirePro's hourly EUR spot index is inching towards -95 levels (which is bearish), while hourly USD spot index was at 50 (bullish) while articulating (at 12:09 GMT).
For more details on the index, please refer below weblink: http://www.fxwirepro.com/currencyindex


