


 Trump Lifts 25% Tariff on Indian Goods in Strategic U.S.–India Trade and Energy Deal
  Bank of Japan Signals Cautious Path Toward Further Rate Hikes Amid Yen Weakness
  Why Trump’s new pick for Fed chair hit gold and silver markets – for good reasons
  U.S. Stock Futures Slide as Tech Rout Deepens on Amazon Capex Shock
  Dollar Near Two-Week High as Stock Rout, AI Concerns and Global Events Drive Market Volatility
  China Extends Gold Buying Streak as Reserves Surge Despite Volatile Prices
  Fed Confirms Rate Meeting Schedule Despite Severe Winter Storm in Washington D.C.
  Silver Prices Plunge in Asian Trade as Dollar Strength Triggers Fresh Precious Metals Sell-Off
  Japanese Pharmaceutical Stocks Slide as TrumpRx.gov Launch Sparks Market Concerns
  ECB’s Cipollone Backs Digital Euro as Europe Pushes for Payment System Independence
  Trump Signs Executive Order Threatening 25% Tariffs on Countries Trading With Iran


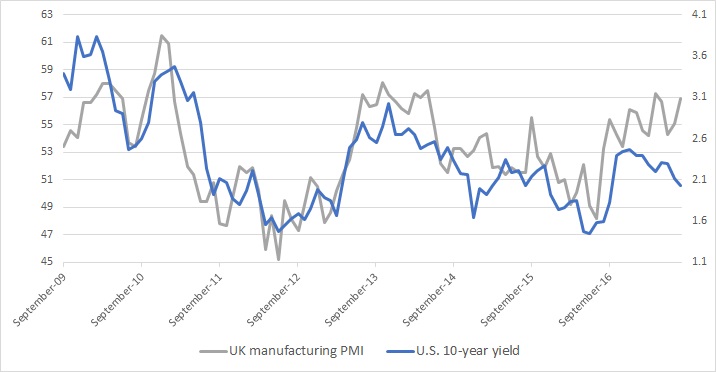
The above four charts show the relation between U.S. 10-year yields and manufacturing PMI numbers from the United States, Switzerland, Eurozone, and United Kingdom. We have chosen U.S treasury as a representative of global yield due to the importance of the U.S. dollar in the global financial system. Even if we had chosen 10-year yield from each region, the outcome wouldn’t be starkly different.
All four charts are showing the close relationship between the manufacturing PMI and 10-year yields, which is not surprising given the fact that central banks do not have much influence on the long term yields, unlike the short-term yields. Long-term yields like 10-years depend on the inflation outlook, state of the economy, savings glut etc.
All four charts have recently been flashing warning signs. A continuing divergence is quite visible for all four charts; extreme for Eurozone. It can be seen that while manufacturing PMI is moving higher, the 10-year treasury yields have been moving lower. For the United States, the divergence began last December and still continuing. For Eurozone, it began back in September 2015. For the UK, the divergence began in 2015, it closed somewhat last year but the gap started widening again since December. For Switzerland, the divergence began December last year and still growing.
While a divergence is n not an all new phenomenon, as can be seen in the chart of U.S. ISM manufacturing PMI and 10-year yields. Back in 2014, a divergence occurred. From March to October 2014, while PMI grew, U.S. treasury yield headed lower. But the divergence collapsed with a slowdown in the economy. So the real question is ‘what will happen this time around? Will yields move higher or will economy slow down?’


