


 FxWirePro: EUR/AUD outlook weaker on renewed downside pressure
  FxWirePro: USD/JPY uptrend loses steam, remains on bullish path
  FxWirePro: GBP/USD hits one-month high, scope for further upside
  FxWirePro: AUD/USD edges lower, but bullish outlook persists
  Crypto Major Pair Action Bias: ETHUSD Bullish as BTCUSD, SOLUSD & XRPUSD Stay Neutral
  FxWirePro:EUR/NZD extends fall, key support lies ahead
  Major Pair Action Bias: Extremely Bullish Surge Powers GBPUSD & NZDUSD as Bullish Momentum Ignites
  FxWirePro- Woodies pivot (Major)
  FxWirePro: NZD/USD steadies around 0.5830,retains bid tone
  GBPUSD, AUDUSD & NZDUSD Turn Extremely Bullish: Strong Positive Momentum Drives Major Pair Action Bias
  FxWirePro: NZD/USD trades in narrow range ,outlook bullish
  FxWirePro: GBP/NZD downtrend slows, but bearish sentiment remains
  NZDJPY Extremely Bullish Above 94: Broad NZD Buying Fuels Fresh Upside – Buy Dips at 93.70 Targeting 95
  FxWirePro: USD/CAD falls after BoC rate hold and weak U.S. producer inflation
  FxWirePro- Major Pair levels and bias summary
  Major JPY Action Bias — Extremely Bullish Setups in NZD/JPY, AUD/JPY and CAD/JPY


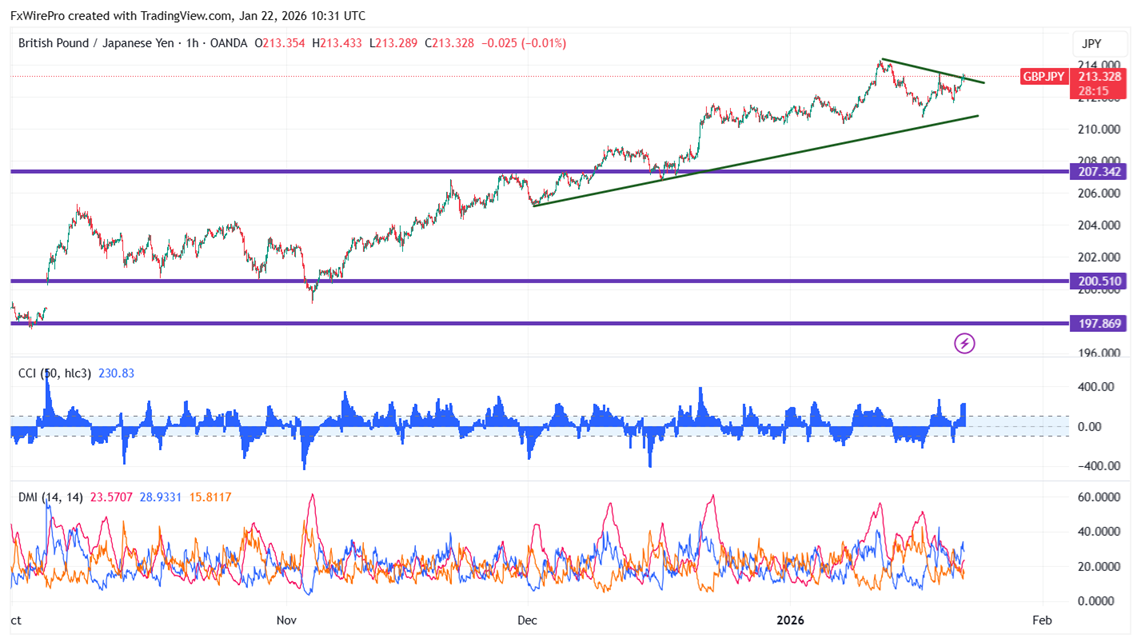
GBPJPY formed a double top around 213.50 and showed a minor sell-off. The intraday trend is bullish as long as support 211.50 holds. As of publishing, it is trading around 213.32; its intraday high is 213.43.
Oscillators and moving averages to forecast the trend of GBPJPY
CMP- 213.33
EMA ( 1-hour chart)
55-EMA- 212.55
200-EMA- 212.29
365-EMA- 211.85. The pair trades above the short (55- EMA) and long-term moving average (200 and 365 EMA).
Major Support- 212.75. Any breach below will drag the pair down to 212.35/211.85/211/210.70/210..
Major resistance - 213.50. Any break above 213.50 confirms minor bullishness; a jump to 214/214.29/215.18 is possible.
Indicator (1-hour chart)
CCI (50)- Bullish
Average directional movement Index- Bearish. All indicators confirm a bullish trend.
It is good to buy on dips around 212.80 with SL around 211.70 for a TP of 215.15.


