


 FxWirePro- Major Crypto levels and bias summary
  Aussie Ascent: AUDJPY Reclaims 110.00 as Bullish Momentum Ignites
  FxWirePro:NZD/USD remains vulnerable as Trump's latest deadline leaves investors on edge
  Bitcoin Resilience: BTC Reclaims USD 69,000 as Geopolitical Tensions Ease
  FxWirePro: USD/JPY holds range near 160 as intervention risks loom
  FxWirePro: EUR/ NZD consolidating around 2.0200, room for further gains
  FxWirePro: EUR/AUD eases as market awaits Iran deadline
  Aussie Retreats Against the Yen: AUDJPY Bears Target 108 as 110 Resistance Holds Firm
  FxWirePro- Major Crypto levels and bias summary
  FxWirePro- Woodies Pivot(Major)
  FxWirePro- Woodies Pivot(Major)
  Euro Retreats as Geopolitical Tensions Surge: EURUSD Eyes 1.1400 Floor Amid Safe-Haven Demand
  FxWirePro: EUR/AUD eases slightly but trend is still bullish
  FxWirePro: GBP/USD outlook weaker on renewed downside pressure


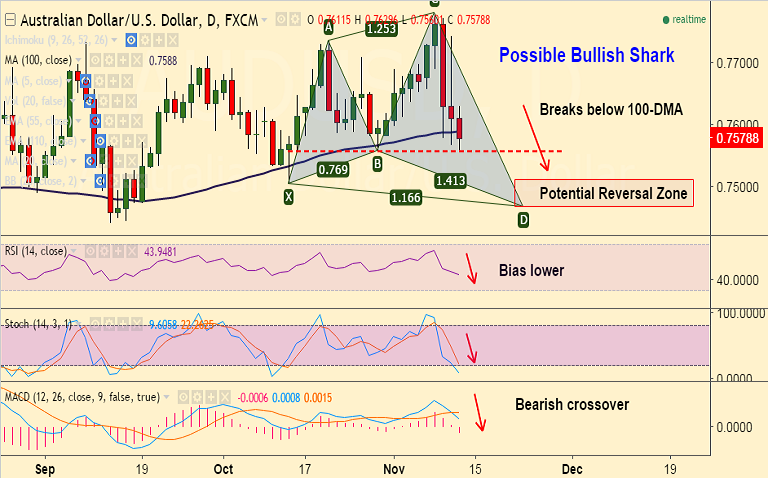
- Possible "Bullish Shark: pattern seen on AUD/USD daily charts.
- The pair has broken below 100-DMA support at 0.7588.
- Downside finds major support at 0.7556 (trendline), violation there could see drag till 0.75 levels.
- Technical indicators are heavily bearish. We see scope for downside.
- Stochs and RSI are biased lower, while MACD line shows a bearish crossover on signal line.
Recommendation: Good to sell on rallies around 0.7580/90, SL: 0.7645, TP: 0.7536/ 0.75
Resistance
R1 - 0.7628 (23.6% Fib)
R2 - 0.7645 (20-DMA)
R3 - 0.7661 (5-DMA)
Support
S1 - 0.7556 (trendline)
S2 - 0.7536 (38.2% Fib)
S3 - 0.75


