


 AUDJPY Range Traps Bulls: Sell Rallies at 112.60, Target 110
  FxWirePro: USD/CAD trades in tight range as markets track Middle East conflict
  FxWirePro: USD/CAD runs out of steam but maintains bullish outlook
  FxWirePro- Major Crypto levels and bias summary
  FxWirePro: NZD/USD hits three-week high, scope for further upside
  ETHUSD Bullish Momentum: Follows BTC Above All EMAs, Buy Dips Near $1750 Targeting $2300
  FxWirePro: NZD/USD dips as geopolitical tensions weighs on Kiwi dollar


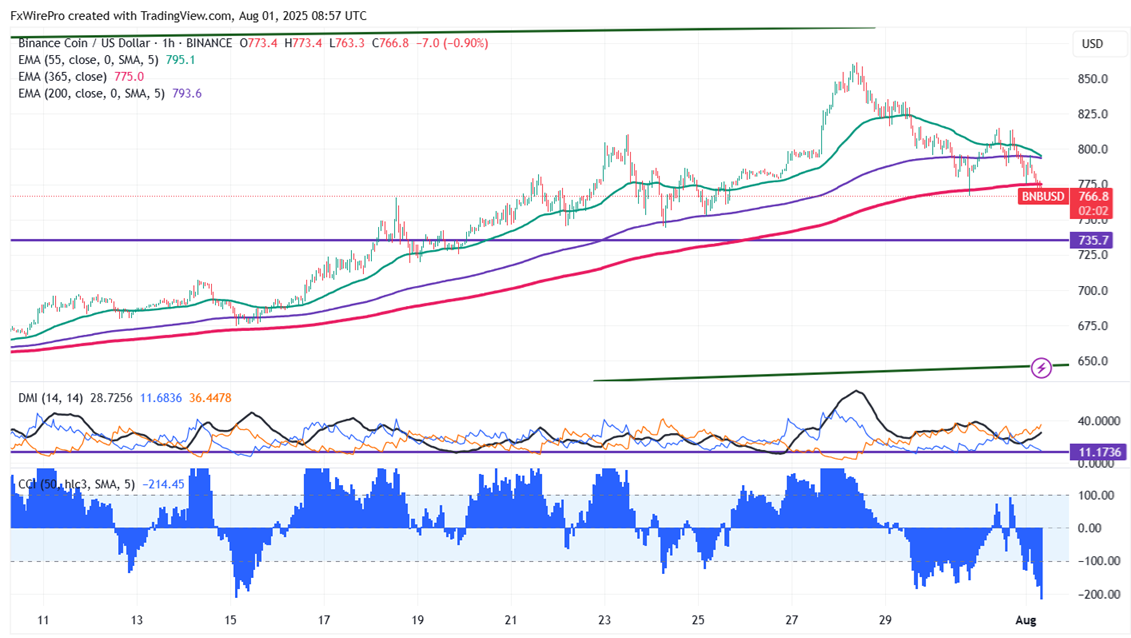
BNB/USD trades weakly following the footsteps of BTC. It hit an intraday low of $763.30 yesterday and is currently trading around $768.10.
Short-term trend remains bullish as long as the support $698 holds. It trades below the 55 and 34, 200 and 365 EMA on the 1-hour chart. Near-term support is around $760, any close below targets $735/ $700/$670/$650/$644/$628/$598. If the pair closes below $500, potentially lead to further declines towards $400.
Immediate Resistance is at $780.Any breakout above this resistance confirms bullish momentum and a jump towards $800/$820/$830/$862/$900/$1000.
Indicators ( 1-hour Chart)
Directional Movement Index: Neutral
CCI (50): Bearish
Trading Strategy
It is good to buy on dips around $700 with a stop-loss set at $600 and a target price of $1000.


