


 GBPJPY Stuck in Tight Range – Neutral Bias Persists Despite Bullish EMAs
  FxWirePro- Major Crypto levels and bias summary
  FxWirePro: GBP/AUD loses momentum but outlook is bullish
  GBPUSD, AUDUSD & NZDUSD Turn Extremely Bullish: Strong Positive Momentum Drives Major Pair Action Bias
  FxWirePro- Major Pair levels and bias summary
  FxWirePro- Major Crypto levels and bias summary
  GBPJPY Bullish on Consolidation: Holds Above 216 After 218 Top – Buy Dips at 217 Targeting 220
  FxWirePro- Major Pair levels and bias summary


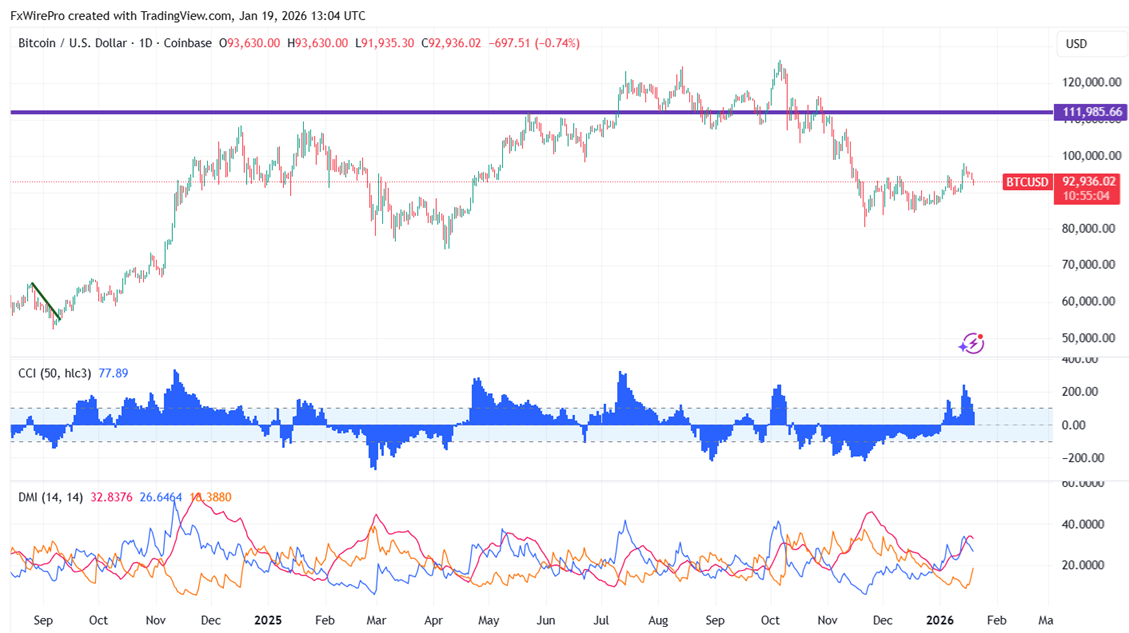
BTCUSD gave back most of its gains as US-EU trade tensions rose. It dropped to a low of $91900 during the day and is now trading at about $93071.
Oscillators and moving averages to forecast the trend of BTCUSD
CMP- $95159
EMA (4- hour chart)
55-EMA- $93888
200-EMA- $91850
365-EMA- $93021. The pair trades above the short-term (55 EMA) and above the 200 and 365 EMA long-term moving averages.
Major Support - $91800. Any breach below $91800 will drag the pair down to $90000/$88356/$86650/$84440/$83000/$80000.
Major Resistance - $93375. Any break above $93500 confirms minor bullishness, a jump to $95000/$97400/$98500/$10000/$107000.
Indicators (4-hour chart)
CCI(50)- Bullish
ADX- Neutral
5. Investment Strategy for BTCUSD
It is good to buy on dips around $92000 with a stop loss around $90000 for target profits of $100000/$107000.


