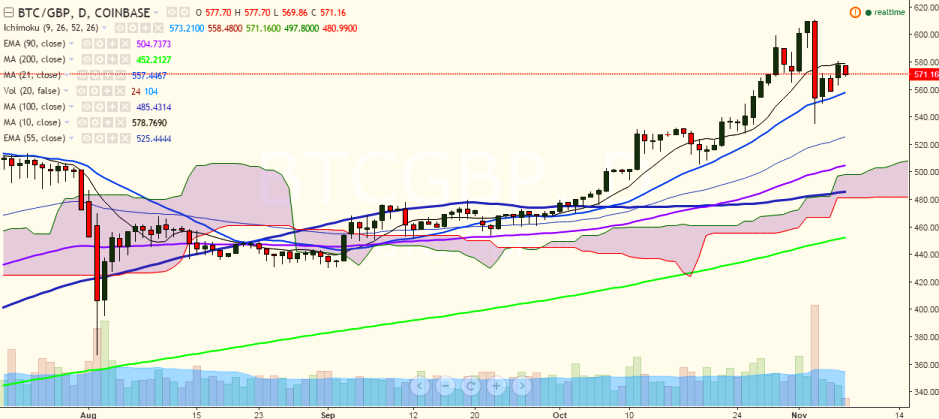
BTC/GBP is struggling to break above 10-day MA and is currently trading at 571.20 levels (Coinbase).
Long-term trend: Bullish
Short-term trend: Bullish
Ichimoku analysis of daily chart:
Tenkan Sen: 573.21
Kijun Sen: 558.48
Trend reversal: 503.24 (90 EMA)
“The pair has taken support near 21-day MA after falling to 535.30 levels on November 03. Both short- and long-term trend appear bullish for the pair and a break above 10-day MA would target 611 (November 03 high)”, FxWirePro said.
On the topside, BTC/GBP faces resistance at 578.77 (10-day MA) and a break above would see the pair testing 611.12 (November 03 high)/650.00.
On the flipside, support is seen at 555.43 (21-day MA) and a break below would target 535 (November 03 low)/523.75 (55 EMA).