


 Major JPY Action Bias — Extremely Bullish Setups in NZD/JPY, AUD/JPY and CAD/JPY
  FxWirePro: GBP/AUD loses momentum but outlook is bullish
  FxWirePro: AUD/USD firms slightly, but downward resumption looks likely
  FxWirePro :USD/JPY bulls loosen their grip a bit, dips to be bought
  NZDJPY Smashes 4-Month High on Kiwi Buying Frenzy – Bullish Setup Remains Strong
  Crypto Major Pair Action Bias: ETHUSD Bullish as BTCUSD, SOLUSD & XRPUSD Stay Neutral
  FxWirePro: NZD/USD advances as hawkish outlook by a top policy maker boosts kiwi dollar
  GBPJPY Bullish on Consolidation: Holds Above 216 After 218 Top – Buy Dips at 217 Targeting 220


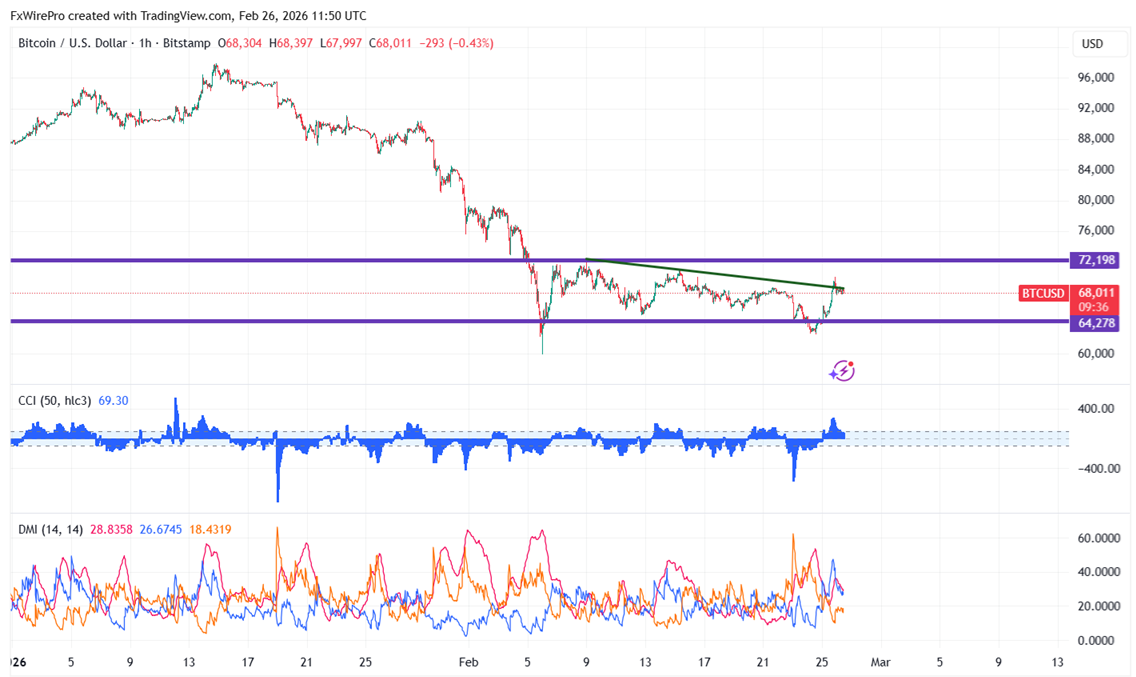
BTCUSD trades flat going into US-Iran negotiations. Yesterday it reached $70,038, but it is presently trading at $68,180.
|
Technicals |
CMP -$68012 |
Trend |
|
|
1- Hour chart |
Value |
|
|
|
55 EMA |
$66829 |
CMP > 55 EMA |
Bullish |
|
200- EMA |
$66850 |
CMP > 200- EMA |
Bullish |
|
365- EMA |
$68121 |
CMP < 365 EMA |
Bearish |
Major support- $64000/$60000/$52500/$50000. Minor bullishness only above $70050.Any break above targets $74800/$78750
|
Momentum indicator (4-hour chart) |
Inference |
Value |
|
CCI(50) |
Bullish |
82.29 |
|
ADX |
Neutral |
|
It is good to buy above $67500 with SL around $63000 for a TP of $74800/$78700.


