


 FxWirePro: GBP/NZD stuck in range but outlook is bullish
  FxWirePro- Major Crypto levels and bias summary
  FxWirePro- Major Crypto levels and bias summary
  FxWirePro: USD/CAD steadies around 1.3990 ,retains bid one
  FxWirePro: AUD/USD climbs as US-Iran peace deal sparks risk rally
  FxWirePro: USD/ZAR edges higher, set to stay on back foot
  Peace Dividend Powers NZDJPY Past 93.50 — Bulls Set Sights on 96.15 Target
  FxWirePro- Major Crypto levels and bias summary
  FxWirePro: NZD/USD jumps after US and Iran agree preliminary deal
  FxWirePro: GBP/USD range-bound as Iran uncertainty keeps traders cautious
  BTC’s Bear Bounce: Sell the Rally Near $66K as Bears Target $59K–$52K Breakdown


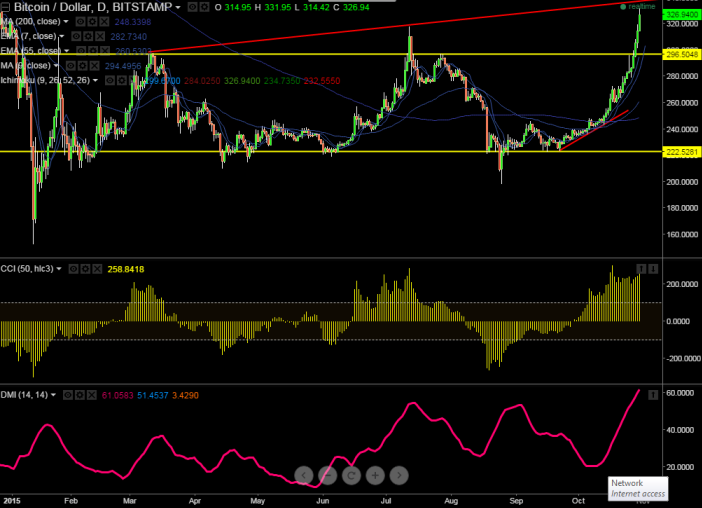
BTC/USD has broken major resistance $318 (Jul 2nd 2105) and jumped till $332. It is currently trading at $325.
- The pair is facing trend line resistance around $338 (trend line joining $298 and 317.99) and break above confirms further bullishness, a jump till $353/$380 is possible
- Short term trend is bullish as long as support $313 holds.
- On the downside any break below $313 will drag the pair further down till $300/$288.
It is good to buy at dips around $325 with SL around $313 for the TP of $338/$353


