


 FxWirePro-24-Hour Crypto Category-Based Performance Dashboard
  FxWirePro- Major Crypto levels and bias summary
  Bitcoin Surges Past $85,000 Amidst Rising Risk Appetite
  FxWirePro- Major Crypto levels and bias summary


 Add as a preferred source on Google
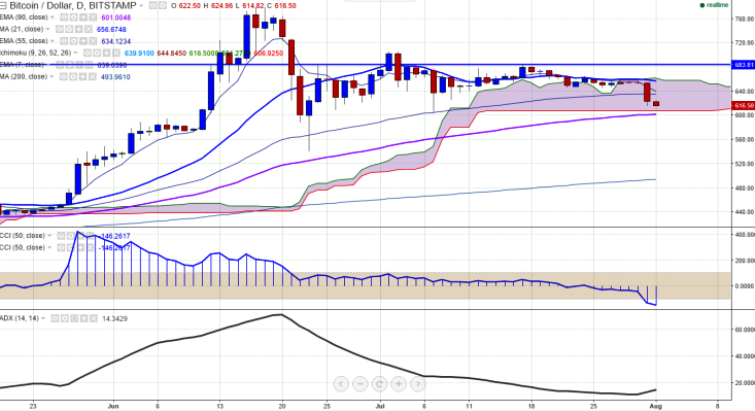
BTC/USD has broken minor resistance $645 and declined till $614.97 at the time of writing. It is currently trading at $617.79 levels (Bitstamp).
Ichimoku analysis (Daily chart):
Tenkan-Sen level: $639.98
Kijun-Sen level: $644.84
Trend reversal level: $600 (90 EMA)
“BTC/USD trades well below 55 day EMA. So further decline till $540 is possible”, FxWirePro said in a statement.
Long-term trend remains bullish for the pair and it faces major resistance around $635 (55 day EMA) and any break above will target $647(7 day EMA)/ $665 (Jul 24 low). On the reverse side, short-term support is seen at $600 (90 day EMA) and any violation below will drag the pair till $540 (Jun 23 low).

- News

- Economy

- Central Banks
- Investing
- Research
- Roundups
- Digital Currency
- Insights
- Technical Analysis
- Technology
- Business
- Law
- Health
- Nature
- Fintech
- Science
- Topic
- Opinions
- ©Econometrics LLC . All Rights Reserved.
BTC/USD trades weak, decline till 540 likely
Monday, August 1, 2016 4:00 AM UTC
Editor's Picks



- Market Data
Most Popular




