


 NZDJPY Smashes 4-Month High on Kiwi Buying Frenzy – Bullish Setup Remains Strong
  FxWirePro- Major Crypto levels and bias summary
  FxWirePro- Major Crypto levels and bias summary
  Crypto Major Pair Action Bias: ETHUSD Bullish as BTCUSD, SOLUSD & XRPUSD Stay Neutral
  FxWirePro- Woodies pivot (Major)
  FxWirePro: AUD/USD remains buoyant, looks to extend gains
  FxWirePro: NZD/USD advances as hawkish outlook by a top policy maker boosts kiwi dollar
  FxWirePro: USD/CNY edges lower , bearish outlook persists
  FxWirePro: NZD/USD steadies around 0.5830,retains bid tone


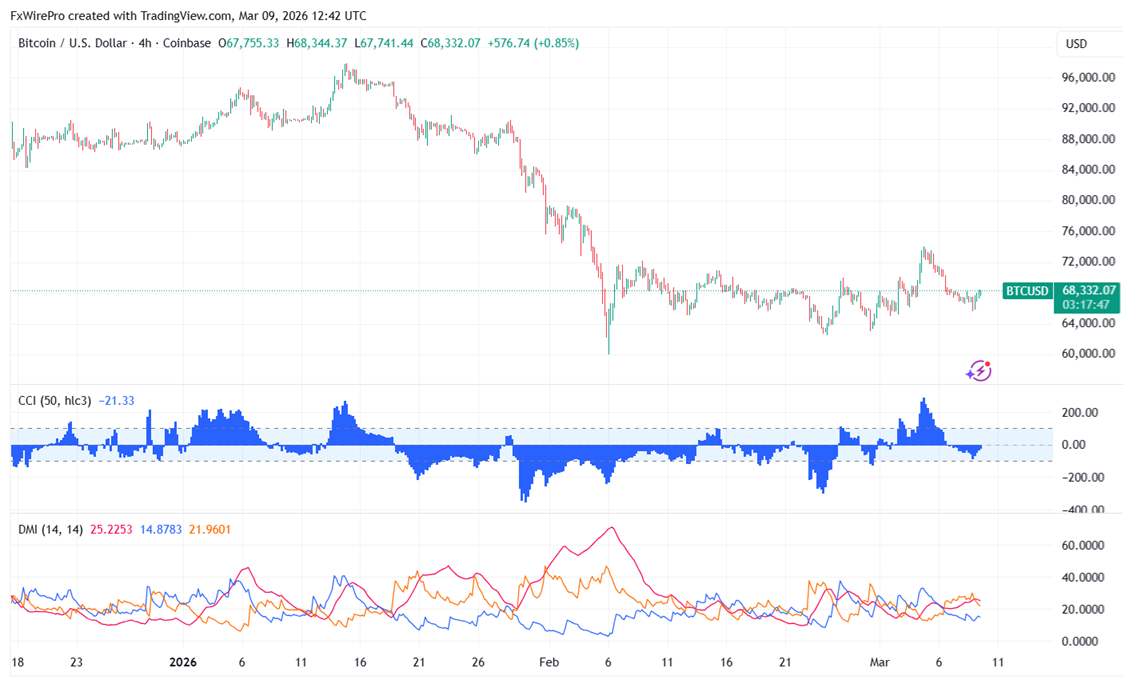
As crude oil prices rose, BTCUSD faded its radiance. It is presently trading around $68236 and has reached a low of $65618.
|
Technicals |
CMP -$68187 |
Trend |
|
|
4- Hour chart |
Value |
|
|
|
55 EMA |
$68217 |
CMP > 55 EMA |
Bullish |
|
200- EMA |
$70596 |
CMP <200- EMA |
Bearish |
|
365- EMA |
$75296 |
CMP < 365 EMA |
Bearish |
Major support- $64000/$60000/$52500/$50000. Minor bullishness only above $72500.
|
Momentum indicator (4-hour chart) |
Inference |
Value |
|
CCI(50) |
Bullish |
97.60 |
|
ADX |
Bullish |
Strength increased from 14.59 to 16.25 |
It is good to buy on dips around $67000 with SL around $64000 for a TP of $80000.


