


 Solana Whale Moves $51M in SOL to Coinbase Amid Price Drop
  Crypto Liquidation Flush: BTC & ETH at a Glance
  Stellar Overtakes Ethereum in RWA Fund Inflows as XRP Leads Commodities
  Bitcoin Rebounds to $82K as Trump Eases Iran War Fears
  Bitcoin Rebounds to $82K as Crypto Market Faces Weekly Losses
  Morgan Stanley Raises Coinbase Stock Price Target to $258 Ahead of Earnings
  Cardano Price Drops 14% as ADA Funding Rate Hits Four-Month Low
  MSTR Stock Rises as Barclays Raises Price Target to $175
  XRP Ledger Agentic Payments Surge Past 13 Million Transactions
  Ripple Chairman Chris Larsen Donates $22.5 Million Ahead of US Midterms
  Zcash Plans Quantum-Resistant Security Upgrade for January
  BNB Price Faces Pressure as DOJ Investigates Binance


 Trigger a Correction? - EconoTimes)


 Add as a preferred source on Google
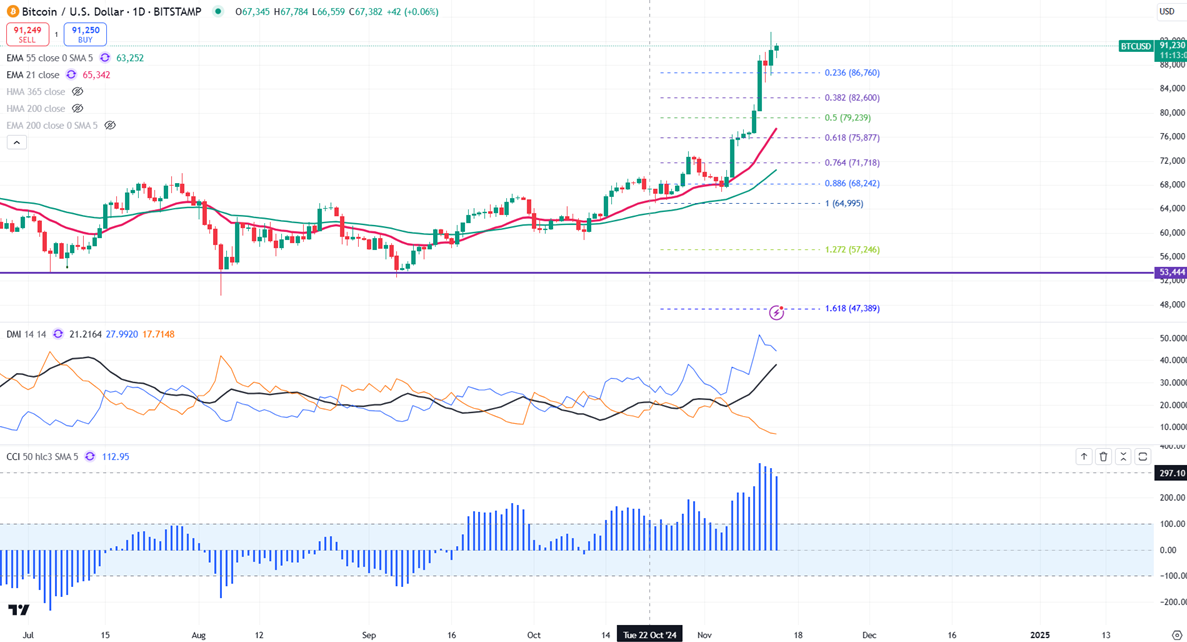
Bitcoin (BTCUSD) reached a fresh all-time high of $93483 and showed a minor sell-off.It is currently trading at around $91122.
Increased Selling Pressure from Miners
This week, Bitcoin's Miner Position Index (MPI) reached a yearly high, indicating increased selling pressure from miners who are cashing in on profits after Bitcoin's recent surge to an all-time high of $89,940. The MPI rose to 3.56, suggesting that a price correction may be on the horizon, as miner selling often signals market peaks. In line with this, Bitcoin's price has declined to approximately $87,600, extending losses due to profit-taking among miners. Historically, high MPI levels have preceded significant price drops, as seen in November 2023 when a spike led to a more than 6% decline. Despite this selling pressure, there remains optimism in the market due to strong institutional interest in Bitcoin ETFs, which could help mitigate potential declines. Overall, the rise in the MPI reflects a shift in miner behavior, indicating possible volatility in Bitcoin's price. It shows a minor correction possible in Bitcoin.
In the past two weeks, long-term Bitcoin whales have realized about $1.2 billion in profits by selling some of their holdings. This level of profit-taking is significant compared to previous cycles, indicating that these big investors are taking advantage of Bitcoin's recent price rises. On-chain data also shows a surge in whale transactions, with the number of transactions reaching its highest in over ten weeks. This increase suggests that whales are actively moving their assets, typically a sign of profit-taking, especially during a time when prices have been rising.
Technicals-
BTCUSD trades above short-term moving average 34- EMA and 55 EMA and the long-term moving average (200 EMA) in the daily chart.
Minor support- $88000. Any break below will take it to the next level at $84000/$80000/$75800.
Bull case-
Primary supply zone -$95000. Any break above confirms an intraday bullishness. A jump to $100000 is possible.
Secondary barrier- $100000. A close above that barrier targets $110000.
Indicator (4-hour chart)
CCI (50)- Bullish
Average directional movement Index - Bullish
It is good to Sell on rallies around $97800-$98000 with SL around $102000 for TP of $90000/$100000.







