


 ETHUSD Bullish Momentum: Follows BTC Above All EMAs, Buy Dips Near $1750 Targeting $2300
  FxWirePro :USD/JPY bulls loosen their grip a bit, dips to be bought
  FxWirePro: NZD/USD steadies around 0.5830,retains bid tone
  FxWirePro: USD/CNY edges lower , bearish outlook persists
  GBPJPY Bullish on Consolidation: Holds Above 216 After 218 Top – Buy Dips at 217 Targeting 220
  FxWirePro: GBP/NZD downtrend slows, but bearish sentiment remains
  NZDJPY Smashes 4-Month High on Kiwi Buying Frenzy – Bullish Setup Remains Strong


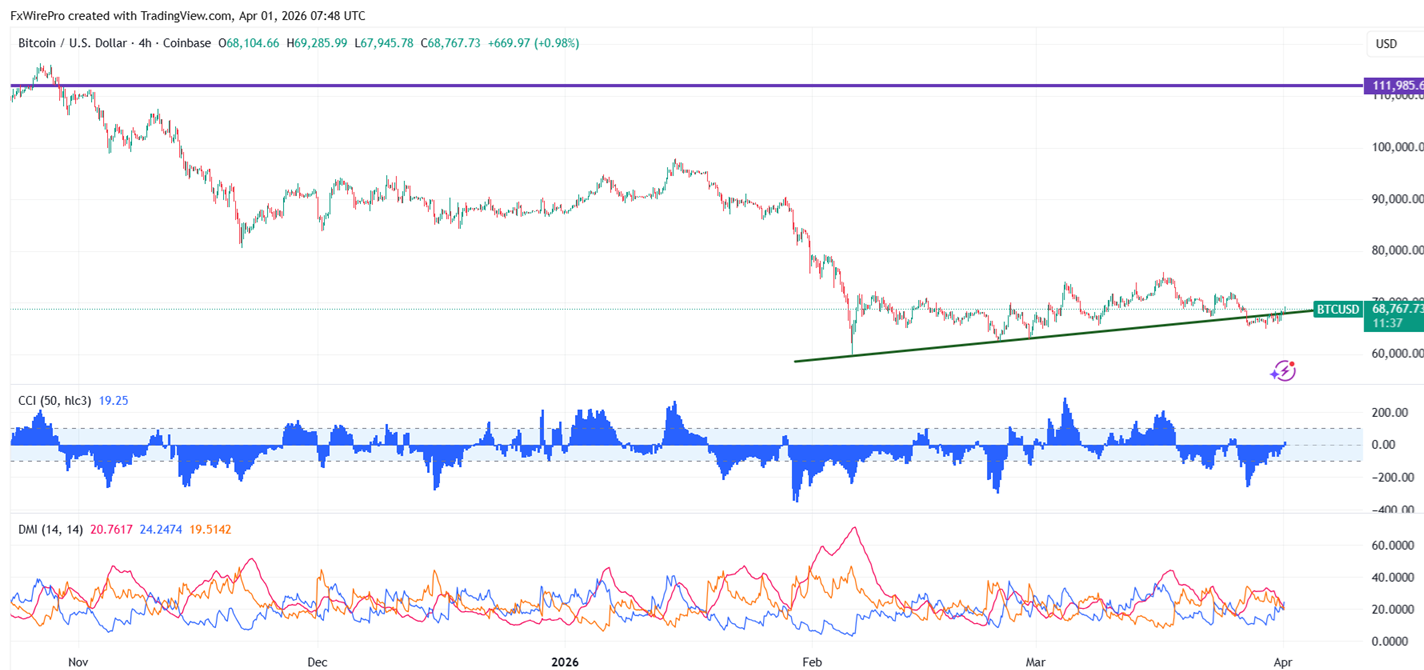
BTCUSD surged sharply on easing geopolitical tension.It reached an low of $64938 yesterday, and is currently trading around $68867.
|
Technicals |
CMP -$68867 |
Trend |
|
|
4- Hour chart |
Value |
|
|
|
55 EMA |
$68094 |
CMP< 55 EMA |
Bearish |
|
200- EMA |
$69960 |
CMP <200- EMA |
Bearish |
|
365- EMA |
$72306 |
CMP <365 EMA |
Bearish |
Major support- $67000/$64000/$60000/$52500/$50000. Minor bullishness only above $72500. Any break above targets $74500/$76200/$80000/$85500.
|
Momentum indicator (4-hour chart) |
Inference |
Value |
|
CCI(50) |
Bearish |
-11 |
|
ADX |
Neutral |
|
It is good to buy on dips around $67000 with SL around $64000 for a TP of $80000.


