


 J.P. Morgan Sees Major Upside for Prysmian as Optical Fiber Prices Surge
  Gold Tumbles Below $4,400 on NFP Shock: Fed Easing Bets Crater, Sell on Rallies to $4,300


Bitcoin (BTCUSD) is consolidating after hitting a fresh all-time high of $93,483. It is currently trading at around $89913.
Market Value to Realized Value (MVRV) Ratio Analysis
The Market Value to Realized Value (MVRV) ratio is an important tool for evaluating Bitcoin's value, showing that it is currently not overvalued. The MVRV ratio is calculated by dividing Bitcoin’s market value by its realized value, helping to determine if the asset is overvalued or undervalued. Right now, Bitcoin's MVRV ratio is about 2.47, which indicates that holders are making profits but not at extreme levels seen in past market highs. Bitcoin's price is around $90,314, up over 40% in the last month, and increasing activity in transactions suggests growing demand. Overall, the MVRV ratio signals that Bitcoin may have room to grow rather than being overvalued, which is a good sign for future price increases.
Miner Position Index (MPI) Insights
On November 14, 2024, the Miner Position Index (MPI) for Bitcoin surged to 3.56, its highest level this year, indicating that miners are selling more Bitcoin than usual.
Significant Inflows in Bitcoin ETFs
On November 14, 2024, U.S. Bitcoin ETFs saw significant inflows of about $2.4 billion for the week, driven by increased investor interest. BlackRock's iShares Bitcoin Trust (IBIT) led these inflows with nearly $1.8 billion, making up 73% of the total. As of that date, these ETFs held around 1.07 million BTC, valued at approximately $96 billion.
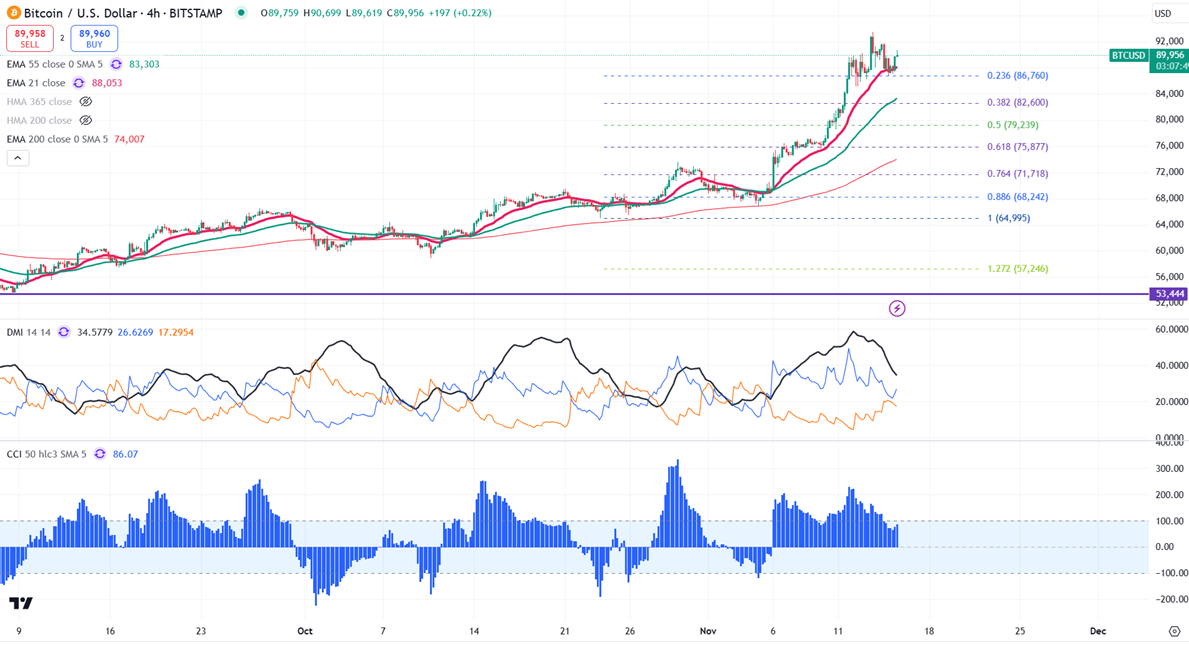
Technical Analysis and Price Levels
BTCUSD trades above the short-term moving averages (34-EMA and 55-EMA) and the long-term moving average (200-EMA) in the daily chart. Minor support is at $86,700; any break below this will target $84,000, $80,000, or $75,800.
Bullish Scenarios and Investment Strategy
In the bullish case, the primary supply zone is at $95,000. A break above this level confirms intraday bullishness, with a potential jump to $100,000. A secondary barrier at $100,000 suggests that a close above this level could target $110,000. Indicators on the 4-hour chart, including a bullish Commodity Channel Index (CCI) and Average Directional Movement Index, support this outlook. It may be good to buy on dips around $80,000, with a stop-loss around $76,000 for a target price of $100,000.


