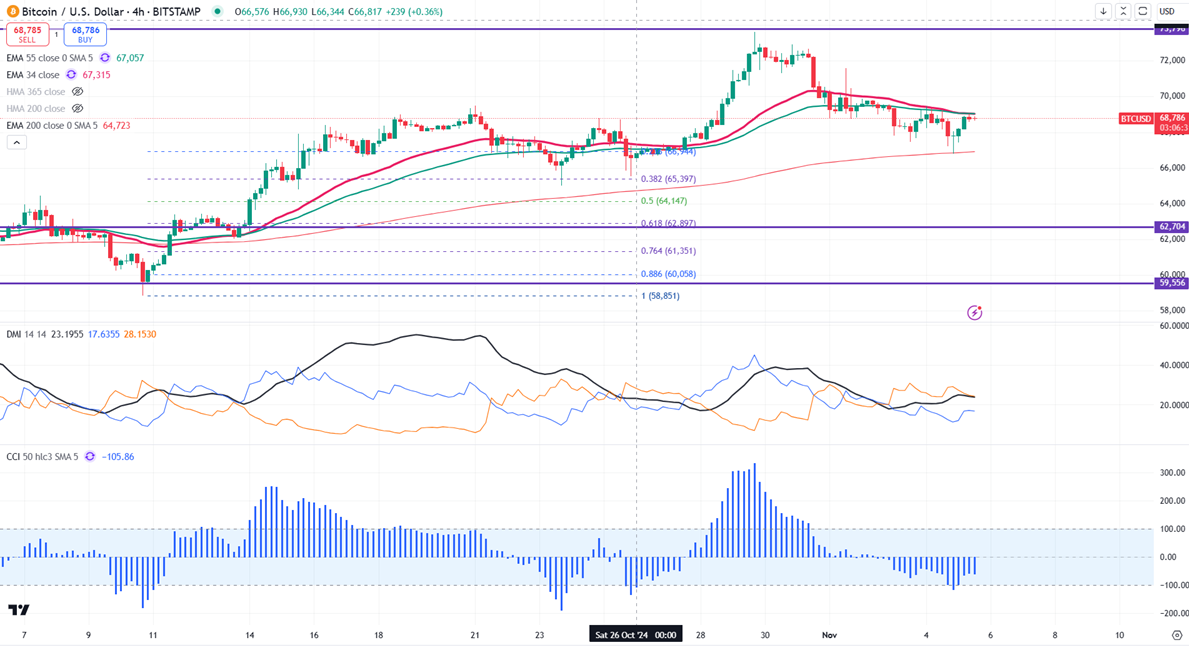
BTCUSD trades highly volatile ahead of the US election. It hit a low of $66798 yesterday and is currently trading at around $68839.
The election results could either boost Bitcoin prices to new highs or cause big drops, depending on how the new administration is seen to handle regulations.
Whales Activity:
Recent whale activity in Bitcoin (BTC) has been significant, highlighting the movements of large investors. A prominent whale withdrew 2,000 BTC (around $137 million) from the Bybit exchange, bringing their total to 51,710 BTC, worth about $3.57 billion. Additionally, since November 1, five whale addresses have bought a total of 2,780 BTC (about $192.4 million) despite Bitcoin's recent dip below $70,000. This accumulation indicates that these investors are optimistic about future price increases.
On November 4, 2024, Bitcoin exchange-traded funds (ETFs) faced significant outflows, totaling 541 million, marking the second-largest daily withdrawal in their history. This followed a period of strong inflows exceeding 3 billion since October 23. Fidelity's Bitcoin ETF led the outflows with $170 million withdrawn, while Ark Invest's ARKB and Bitwise's BITB saw withdrawals of $138 million and $80 million, respectively. Despite the overall trend, BlackRock’s IBIT ETF had a net inflow of $38 million, showing some strength in the market.
US markets -
NASDAQ (No correlation with BTC) - Bullish (neutral for BTC). The NASDAQ trading flat ahead of the US election results. Any close above 20700 will take the index to 21000.
Technicals-
BTCUSD trades above the short-term moving average of 34- EMA and 55 EMA and the long-term moving average (200 EMA) in the 4-hour chart.
Minor support- $65000. Any break below will take it to the next level at $63000/$60000/ $57000/$55000/$52500/$50000/$46000.
Bull case-
Primary supply zone -$70000. Any break above confirms an intraday bullishness. A jump to $73500/$75000 is possible.
Secondary barrier- $75000. A close above that barrier targets $80000/$85000.
Indicator (4-hour chart)
CCI (50)- Bullish
Average directional movement Index - Neutral
It is good to buy on dips around $63000 with SL around $60000 for TP of $70000.


 FxWirePro- Major Crypto levels and bias summary
  Nasdaq Proposes Fast-Track Rule to Accelerate Index Inclusion for Major New Listings


