


 BTCUSD Bullish Breakout: Clears 800-EMA After Consolidation, Buy Dips Toward $74,900
  GBPUSD, AUDUSD & NZDUSD Turn Extremely Bullish: Strong Positive Momentum Drives Major Pair Action Bias
  EUR/JPY Poised to Slide — Sell Rallies into 185.30 with Eye on 183"
  AUDJPY Surges Above 112.50 on Aussie Momentum – Bullish EMAs Flash Green but Sell Rallies into 111.30
  AUDJPY Extremely Bullish Above 113: Strong AUD Fuels Fresh Rally – Buy Dips at 113 Targeting 115
  Crypto Major Pair Action Bias: ETHUSD Bullish as BTCUSD, SOLUSD & XRPUSD Stay Neutral
  FxWirePro- Major Crypto levels and bias summary


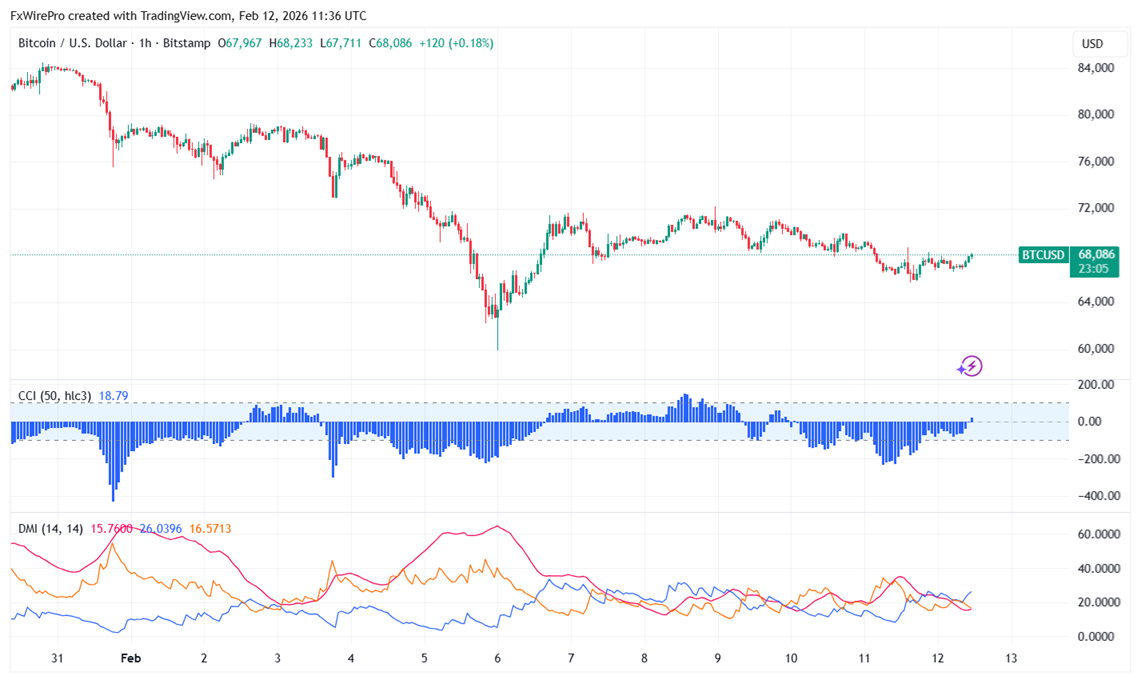
BTCUSD showed a minor pullback from the temporary bottom of $65720 made yesterday. It hits an intraday high of $68233 and is currently trading around $68019.
|
Technicals |
CMP -$68015 |
Trend |
|
|
1- Hour chart |
Value |
|
|
|
55 EMA |
$67895 |
CMP > 55 EMA |
Bullish |
|
200- EMA |
$70564 |
CMP is less than 2200- EMA |
Bearish |
|
365- EMA |
$74252 |
CMP < Value |
Bearish |
In the 4- hour chart, the pair is trading well below short term - $71057 (55-EMA) and long-term- $84992 (365- EMA) and $80396 (200-EMA).
Major support- $64000/$60000/$52500/$50000. Minor bullishness only above $72500.
|
Momentum indicator (1-hour chart) |
Inference |
Value |
|
CCI(50) |
Neutral |
|
|
ADX |
Bullish |
Strength - 15.84. It should cross above 20 level for bullish trend confirmation |
It is good to sell on rallies around $70000 with SL around $74250 for a TP of $60000.


