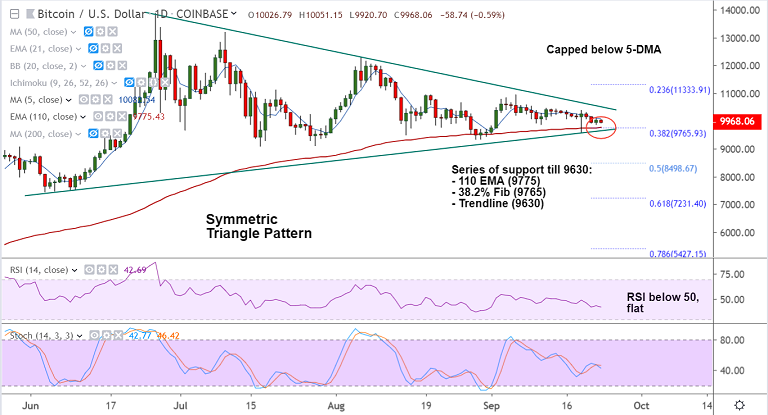
BTC/USD chart - Trading View
Exchange - Coinbase
Support: 9775 (110-EMA); Resistance: 10083 (5-DMA)
Technical Analysis: Bias Bearish
BTC/USD was trading below 10,000 mark at 9971, down 0.55% at 04:00 GMT.
The pair trades with a slightly bearish bias on the intraday charts, major trend remains flat as shown by the GMMA indicator.
Price action continues within the 'Symmetric Triangle' pattern and breakout will provide a clear directional bias.
Volatility is low and the pair finds series of strong supports till 9630 (trendline) - (9775 (110-EMA), 9765 (38.2% Fib)).
RSI is below 50 and ADX supports weakness. Breach at 'Triangle base support will drag prices lower.
Next major support lies at 9363 (21W EMA) ahead of 8498 (50% Fib). On the flipside, 55-EMA is strong resistance at 10258, breakout negates near-term bearish bias.