


 Major Pair Action Bias: Extremely Bullish Surge Powers GBPUSD & NZDUSD as Bullish Momentum Ignites
  Major JPY Action Bias — Extremely Bullish Setups in NZD/JPY, AUD/JPY and CAD/JPY
  JPY Action Bias: Extremely Bullish Surge Ignites Across NZD, GBP & AUD
  ETHUSD Bullish Momentum: Follows BTC Above All EMAs, Buy Dips Near $1750 Targeting $2300
  FxWirePro- Major Crypto levels and bias summary
  Crypto Major Pair Action Bias: ETHUSD Bullish as BTCUSD, SOLUSD & XRPUSD Stay Neutral
  AUDJPY Extremely Bullish Above 113: Strong AUD Fuels Fresh Rally – Buy Dips at 113 Targeting 115
  NZDJPY Extremely Bullish Above 94: Broad NZD Buying Fuels Fresh Upside – Buy Dips at 93.70 Targeting 95
  BTCUSD Bullish Breakout: Clears 800-EMA After Consolidation, Buy Dips Toward $74,900


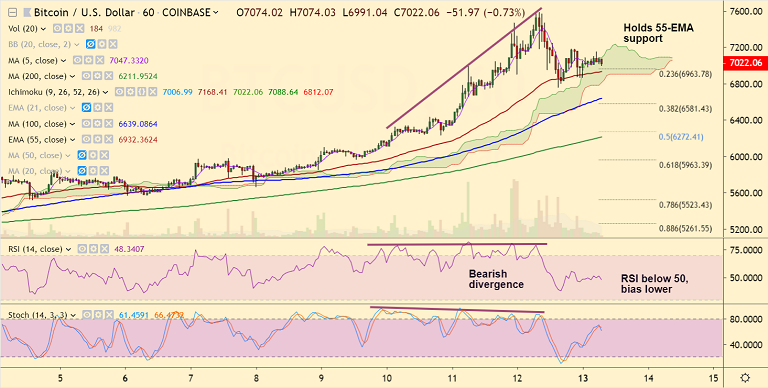
BTC/USD chart - Trading View
Exchange - Coinbase
Support: 5950 (21-EMA); Resistance: 7777 (June 2018 high)
Technical Analysis: Bias Bullish
BTC/USD corrects lower from 10-month highs at 7581 hit on May 12th trade.
The pair still holds bullish momentum and does not show any major signs of correction.
Immediate support seen at 1H 55-EMA at 6932, break below will see weakness.
Price action has dipped into hourly cloud and we see bearish divergence on RSI and Stochs which supports downside.
Break below 1H 55-EMA will see dip till 1H 100-SMA at 6640, and further weakness will take the pair till 1H 200-SMA at 6212.
On the daily charts 21-EMA is strong support at 5950. Resumption of upside will find next resistance at 7777 (June 2018 high).
For details on FxWirePro's Currency Strength Index, visit http://www.fxwirepro.com/currencyindex.

- News

- Economy

- Central Banks
- Investing
- Research
- Roundups
- Digital Currency
- Insights
- Technical Analysis
- Technology
- Business
- Law
- Health
- Nature
- Fintech
- Science
- Topic
- Opinions
- ©Econometrics LLC . All Rights Reserved.
Crypto Technicals: BTC/USD correction from 10-month highs finds support at 1H 55-EMA, break below to see dip till 6600
Monday, May 13, 2019 8:02 AM UTC
Editor's Picks


- Market Data
Most Popular


