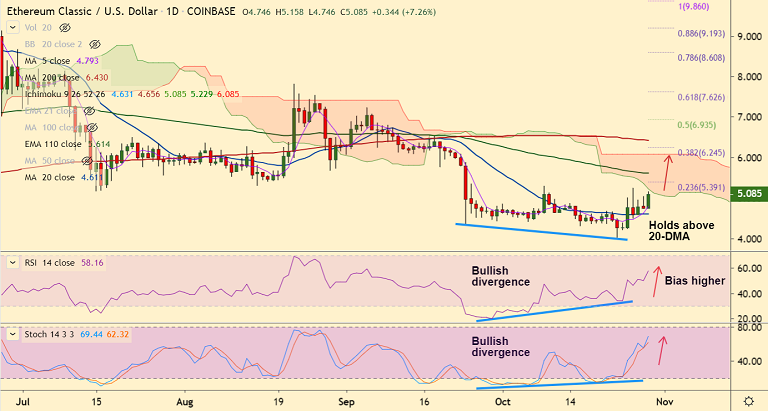
ETC/USD chart - Trading View
Exchange - Coinbase
Support: 4.609 (20-DMA); Resistance: 5.391 (23.6% Fib)
Technical Analysis: Bias Bullish
ETC/USD trades over 6% higher on the day at 5.048 at 05:15 GMT, bias is bullish.
The pair has resumed upside after a brief consolidation above 20-DMA support.
'Bullish divergence' on RSI and Stochs keeps scope for further gains.
Technical indicators support upside. Stochs and RSI are sharply higher. MACD and ADX support uptrend.
Cloud is a major hurdle on the upside. Break above cloud base eyes next resistance at 5.391 (23.6% Fib) ahead of 110-EMA at 5.613.
On the flipside, 5-DMA is immediate support at 4.785. Break below 20-DMA (4.609) negates near-term bullishness.