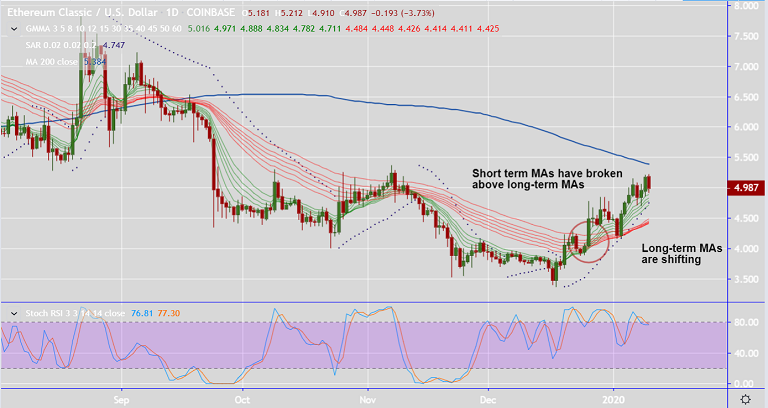
ETC/USD chart - Trading View
Exchange - Coinbase
Technical Analysis: Bias Bullish
GMMA Indicator: Major Trend - Turning Bullish; Minor Trend - Bullish
Overbought/ Oversold Index: Overbought
Support: 4.593 (21-EMA); Resistance: 5.383 (200-DMA)
ETC/USD is showing a strong upside potential with scope for further gains.
The pair has broken above daily cloud and major moving averages. Bullish divergence on RSI and Stochs support upside bias.
Short-term moving averages have broken above long-term moving averages. Confirming near-term bullishness.
Longer-term moving averages have constricted and long-term bias is shifting to bullish.
MACD has shifted into positive territory and positive DMI dominance supports gains.
The pair finds major resistance at 200-DMA (currently at 5.384), breakout above to buoy bulls.
Next major resistance lies at 38.2% Fib at 5.847. Failure at 200-DMA negates near-term bullish bias.