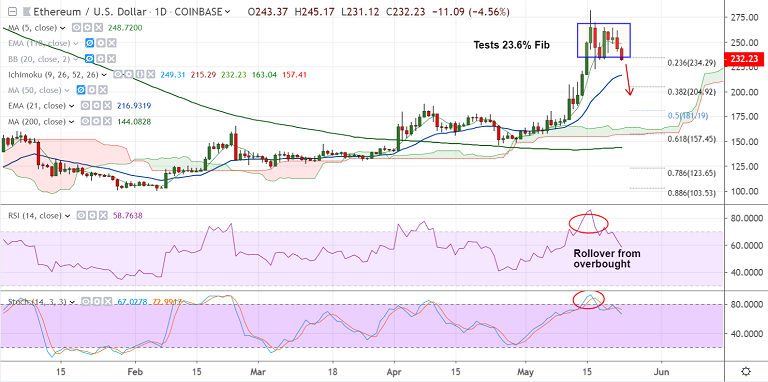
ETH/USD chart - Trading View
Exchange - Coinbase
Support: 216.96 (21-EMA); Resistance: 267.51 (Weekly cloud base)
Technical Analysis: Bias Neutral to Slightly Bearish
ETH/USD trades 3.56% lower on the day at 234.54 at 08:55 GMT.
The pair has broken below 1H 200-SMA and hovers around 23.6% Fib retracement at 234.
5-DMA is flat, Stochs and RSI are showing a rollover from overbought levels.
MACD is on verge of a bearish crossover on signal line and volatility is shrinking.
Break below 230 will see dip till 21-EMA at 217. Break below 21-EMA to see further downside.
On the flipside, the pair finds stiff resistance at weekly cloud, further upside only on break above.
For details on FxWirePro's Currency Strength Index, visit http://www.fxwirepro.com/currencyindex.



Bitcoin Cracks $75K as $1.3B ETF Exodus and Middle East Jitters Spook Bulls; Bears Eye $70K
Ethereum Tumbles Below $2K: Bears Eye $1,700 as All Key EMAs Flip Red
FxWirePro- Major Crypto levels and bias summary
FxWirePro: GBP/AUD downside pressure builds, key support level in focus
Bitcoin Bleeds $704M in ETF Outflows as Institutional Exodus Accelerates
USD/CHF Smashes Higher to 0.7899 on Dollar Dominance—Bulls Bet on 0.7865 Dips for 0.8000 Breakout
FxWirePro: USD/CAD bulls continue to hold the higher ground
FxWirePro- Major Crypto levels and bias summary
FxWirePro- Major Pair levels and bias summary
FxWirePro- Major Crypto levels and bias summary
FxWirePro: GBP/USD recovers some ground but bears are not done yet
FxWirePro: GBP/NZD extends decline , vulnerable to more downside
FxWirePro- Major Crypto levels and bias summary 


