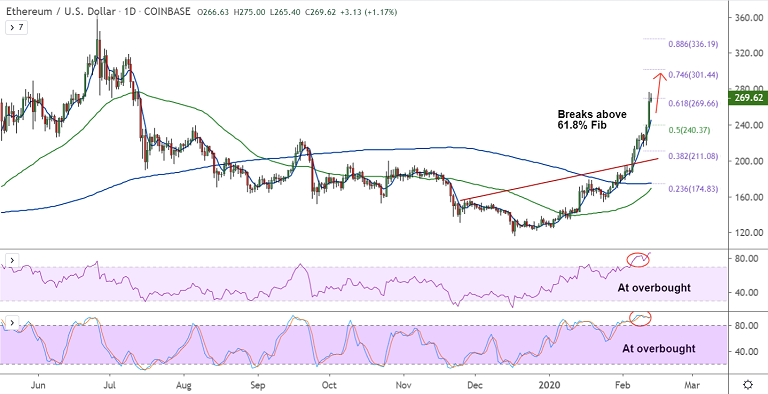
ETH/USD chart - Trading View
Exchange - Coinbase
Technical Analysis: Bias Bullish
GMMA Indicator: Major Trend - Bullish; Minor Trend - Bullish
Overbought/ Oversold Index: Highly Overbought
Volatility: High and Rising
Support: 269.66 (61.8% Fib); Resistance: 300 (psychological mark)
ETH/USD is extending previous session's surge, breaks above 61.8% Fib at 269.66.
The pair was trading 2.53% higher on the day at 272.99 after closing 11.98% higher in the previous session.
Momentum strongly bullish. Volatility is rising on the daily and weekly charts, scope for further upside.
Price action has broken out of weekly cloud and is on track to test $300 levels.
61.8% Fib is immediate support at 269.66. Break below 5-DMA (245.32) will see dip till 21-EMA at 209.62.