ETH/USD chart - Trading View
Exchange - Coinbase
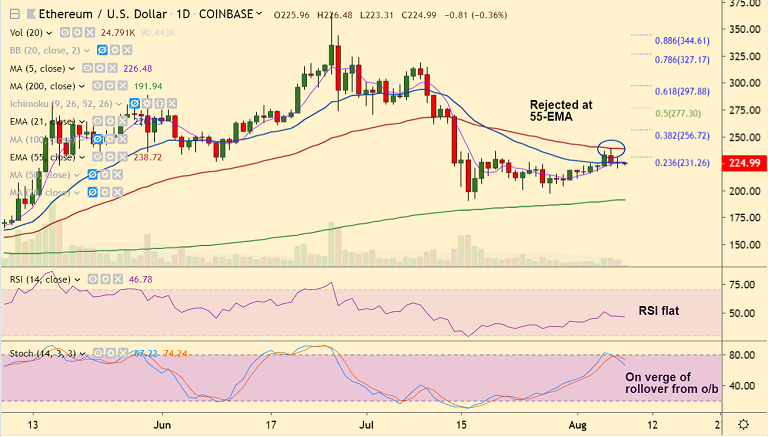
Support: 222.37 (200H SMA); Resistance: 238.73 (55-EMA)
Technical Analysis: Bias turning Bearish
ETH/USD is trading in an extremely narrow range, with session highs at 226.48 and lows at 223.31.
Upside in the pair has been rejected at 55-EMA and technical indicators are turning slightly bearish.
RSI is flat below 50 mark. Stochs are on verge of rollover from overbought territory.
Price action has formed a Doji on Wednesday's candle suggesting indecisiveness.
Uptrend in the pair has ceased as indicated by GMMA indicators with shift in short and long term MAs lower.
Stochastics RSI is also on verge of rollover into neutral territory from overbought zone.
200H SMA (222.37) is strong support. Break below will see further downside. Next major support lies at 191.93 (200-DMA).
Break below 200-DMA could open up downside for the pair. Break above 55-EMA negates near-term bearish bias.