


 FxWirePro- Woodies pivot (Major)
  ETHUSD Bullish Momentum: Follows BTC Above All EMAs, Buy Dips Near $1750 Targeting $2300
  FxWirePro- Major Crypto levels and bias summary
  Major JPY Action Bias — Extremely Bullish Setups in NZD/JPY, AUD/JPY and CAD/JPY
  FxWirePro:EUR/NZD dips below lower range, bearish bias increases
  FxWirePro: NZD/USD steadies around 0.5830,retains bid tone
  BTCUSD Bullish Breakout: Clears 800-EMA After Consolidation, Buy Dips Toward $74,900
  FxWirePro: GBP/USD hits one-month high, scope for further upside
  FxWirePro :USD/JPY bulls loosen their grip a bit, dips to be bought
  FxWirePro: GBP/AUD loses momentum but outlook is bullish
  FxWirePro:EUR/NZD extends fall, key support lies ahead
  FxWirePro: GBP/USD advance after softer US inflation dims Fed rate hike bets


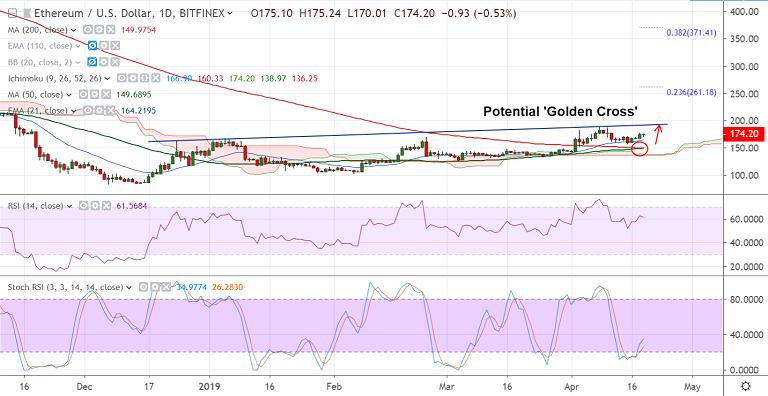
ETH/USD chart - Trading View
Exchange - Bifinex
Support: 164.22 (21-EMA); Resistance: 190.35 (Trendline)
Technical Analysis: Bias Slightly Bullish
- ETH/USD has edged higher from session lows at 170.01, bias slightly bullish
- Price action has edged above 200-DMA for the first time in April, scope for further upside
- Pullback from multi-week highs at 187.98 on April 8th and held above 200-DMA
- The pair finds strong support at 21-EMA (currently at 164.22), break below will see weakness till 200-DMA.
- A 'Potential Golden Cross' formation on the daily charts keeps scope for upside.
- On the upside, continued upside momentum can see gains till trendline resistance at 190.35
For details on FxWirePro's Currency Strength Index, visit http://www.fxwirepro.com/currencyindex.

- News

- Economy

- Central Banks
- Investing
- Research
- Roundups
- Digital Currency
- Insights
- Technical Analysis
- Technology
- Business
- Law
- Health
- Nature
- Fintech
- Science
- Topic
- Opinions
- ©Econometrics LLC . All Rights Reserved.
Crypto Technicals: ETH/USD edges higher from session lows at 170.01, holds above 5-DMA
Friday, April 19, 2019 11:31 AM UTC
Editor's Picks


- Market Data
Most Popular


