


 FxWirePro- Major Crypto levels and bias summary
  AUDJPY Bullish Surge: Strong Australian Dollar Fuels Fresh Upside as Pair Holds Above 113.50 and All EMAs Align
  FxWirePro: NZD/USD trades in narrow range ,outlook bullish
  Crypto Major Pair Action Bias: ETHUSD Bullish as BTCUSD, SOLUSD & XRPUSD Stay Neutral
  JPY Action Bias: Extremely Bullish Surge Ignites Across NZD, GBP & AUD
  FxWirePro: USD/CAD falls after BoC rate hold and weak U.S. producer inflation
  ETH Stands Alone Bullish; BTC, SOL, XRP, BNB Neutral
  FxWirePro: AUD/USD edges lower, but bullish outlook persists


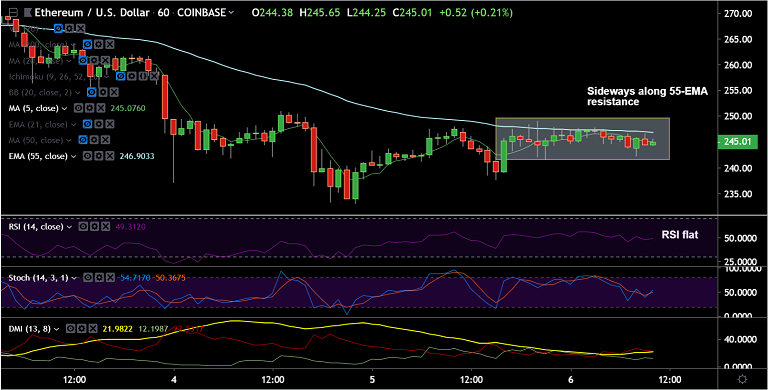
ETH/USD chart - Trading View
Exchange - Coinbase
Support: 239.64 (236% Fib); Resistance: 255.55 (20-DMA)
Technical Analysis: Bias Neutral to Slightly Bearish
ETH/USD grinds sideways at 1H 55-EMA resistance, downside supported at 1H 50-SMA.
RSI and Stochs are flat-lined on the hourly charts, intraday bias is neutral.
Price action has bounced off lower BB and is hovering around 21-EMA.
Technical analysis supports downside. Doji formation on previous weeks' candle limits upside.
Bearish 5-DMA crossover on 20-DMA, 'Bearish Divergence' on RSI and stochs keeps bias lower.
Volatility is shrinking on the daily charts, scope for further consolidation.
Break below 23.6% Fib eyes 55-EMA at 215.45. Retrace above 20-DMA could see further gains.
For details on FxWirePro's Currency Strength Index, visit http://www.fxwirepro.com/currencyindex.


