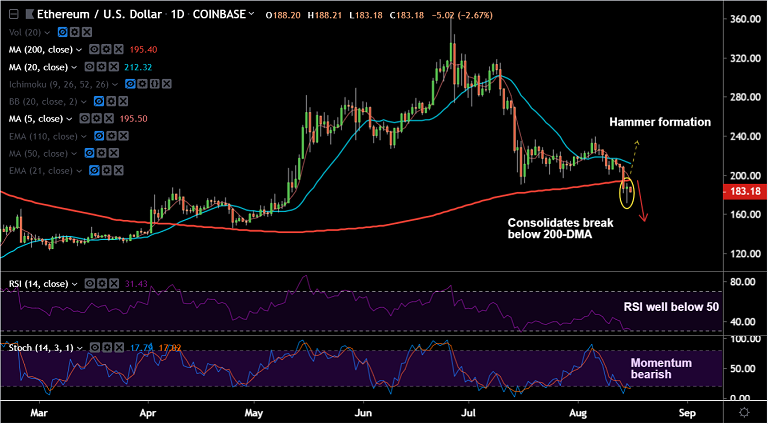
ETH/USD chart - Trading View
Exchange - Coinbase
Support: 168.50 (trendline); Resistance: 189.05 (61.8% Fib)
Technical Analysis: Bias Bearish
ETH/USD has resumed weakness after a brief pause in the previous day's trade.
The pair has ignored 'Hammer' formation on Thursday's trade and technical bias remains bearish.
ETH/USD was trading at 181.37, down 3.72% at 05:45 GMT, consolidates below 61.8% Fib.
No major signs of reversal seen. Bias is bearish and volatility is rising which suggests further downside.
Scope for test of trendline support at 167.85. Violation there to see 146 levels.
On the flipside, 200-DMA is strong resistance at 195.39. Retrace above negates near-term bearishness.



Bitcoin Bleeds $704M in ETF Outflows as Institutional Exodus Accelerates
FxWirePro- Woodies pivot (Major)
FxWirePro- Major Crypto levels and bias summary
Ether Breaks Below $2,100: Triple EMA “Sell-the-Rally” Setup Targets $1,900
FxWirePro- Major Crypto levels and bias summary
FxWirePro: NZD/USD gains as hawkish RBNZ comments boost Kiwi dollar
FxWirePro: GBP/USD edged higher as hopes for US-Iran deal boost riskier assets
FxWirePro: USD/ZAR slips as SARB delivers surprise rate hike
FxWirePro- Major Crypto levels and bias summary
EUR/JPY Bulls Hold the Line Above 185: Eyes Locked on 188 Breakout
ETH Cracks $2,100 in Bitcoin’s Wake as Bearish EMA Stack Deepens; Sellers Target $1,900 on Rallies 


