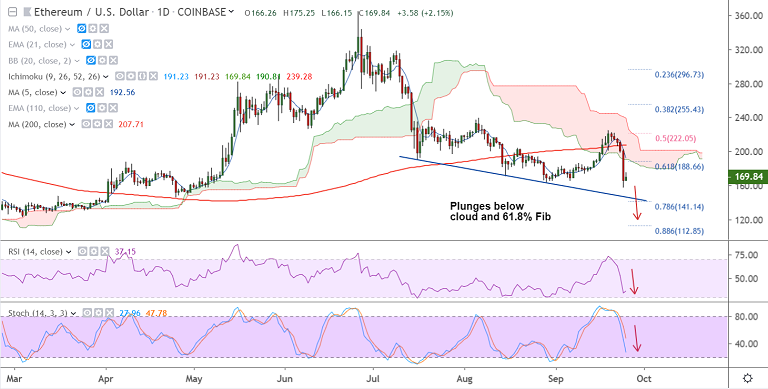
ETH/USD chart - Trading View
Exchange - Coinbase
Support: 146 (trendline and Apr 25 low); Resistance: 177.25 (21H EMA)
Technical Analysis: Bias Bearish
ETH/USD consolidates previous session's slump, bias still strongly bearish.
The pair is attempting a tepid recovery from 4-month lows at 157.75, but upside lacks traction.
Stochs and RSI are sharply lower with room for further downside. RSI is below 50 mark.
MACD shows bearish crossover on signal line and GMMA indicator shows shift in short-term trend to bearish.
Major supports on the downside align at 146 (trendline and Apr 25 low) ahead of 141.14 (78.6% Fib).
Immediate resistance lies at 177.25 (21H EMA), break above could see minor gains.



FxWirePro: GBP/NZD extends decline , vulnerable to more downside
FxWirePro: USD/JPY edges higher but bulls lack punch
Bitcoin Bleeds $704M in ETF Outflows as Institutional Exodus Accelerates
Ethereum Cracks Below $2,000 as Bitcoin Contagion Bites—Bearish EMA Stack Sets Sights on $1,700
FxWirePro- Major Crypto levels and bias summary
FxWirePro: EUR/ NZD dips below lower range, bearish bias increases
FxWirePro- Major Crypto levels and bias summary
FxWirePro- Major Pair levels and bias summary
FxWirePro: GBP/AUD downside pressure builds, key support level in focus
Pound-Yen Roars Back Above 214: Bulls Reload for 216–217 Charge on Dip-Buying Setup
FxWirePro: USD/ZAR slips as SARB delivers surprise rate hike
FxWirePro: NZD/USD gains as hawkish RBNZ comments boost Kiwi dollar
FxWirePro: USD/CNY bears maintain upper hand 


