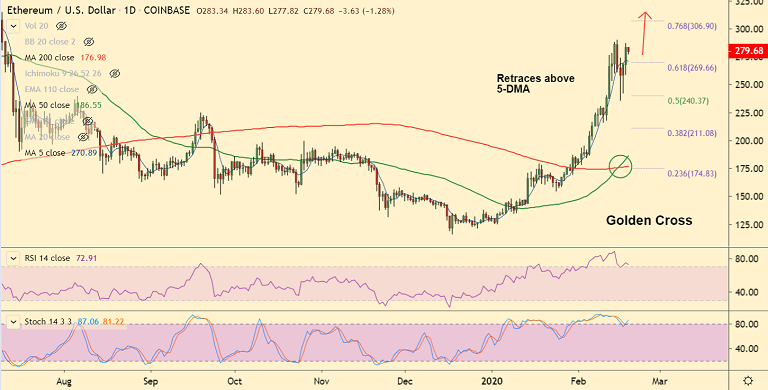
ETH/USD chart - Trading View
Exchange - Coinbase
Technical Analysis: Bias Bullish
GMMA Indicator: Major Trend - Bullish; Minor Trend - Neutral
Overbought/ Oversold Index: Neutral
Volatility: High and Rising
Support: 240.37 (50% Fib); Resistance: 265.63 (5-DMA)
ETH/USD was trading 0.87% higher on the day at 260.82 at around 07:55 GMT.
The pair slumped overnight amid general crypto-market bearishness, closed over 8% lower at 258.66.
Price action hovers around 200H MA and has slipped below 5-DMA, more weakness likely.
A 'Bearish Engulfing' pattern on the daily charts adds to downside pressure in the pair. Dip till 50% Fib at 240.37 likely.
That said, 'Golden Cross' formation (bullish 50-DMA crossover on 200-DMA) limits downside.
5-DMA is immediate resistance at 265.70, retrace above could see upside resumption.