Home / Digital Currency / Article Digital Currency / Technicals
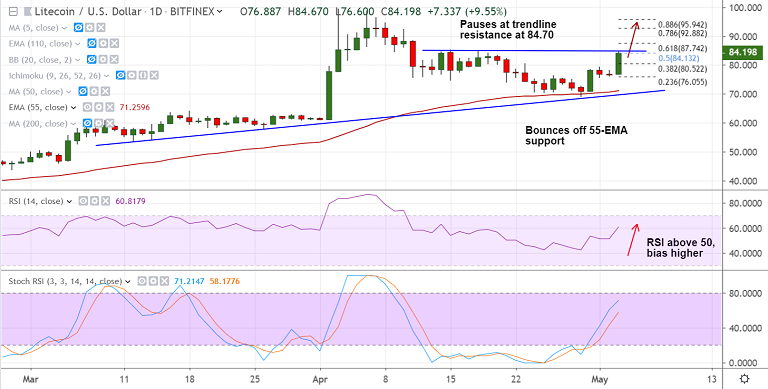
Add as a preferred source on Google Crypto Technicals: LTC/USD bounces off 55-EMA support, hits 2-week highs above 84, bias higher LTC/USD chart - Trading View Exchange - Bitfinex Support: 71.23 (55-EMA); Resistance: 84.70 (trendline) Technical Analysis: Bias Bullish - LTC/USD spikes over 9% to hit 2-week highs at 84.67 - Price action has bounced of…
By FxWirePro Team May 3, 2019, 10:12 AM UTC
Image from the original EconoTimes article Read the original article
LTC/USD chart - Trading View Exchange - Bitfinex Support : 71.23 (55-EMA); Resistance : 84.70 (trendline)Technical Analysis: Bias Bullish For details on FxWirePro's Currency Strength Index, visit http://www.fxwirepro.com/currencyindex .
Digital Currency SILVER was set at 2x cross leverage; GOLD was set at 1x.
Digital Currency The swaps reference Trade.xyz perpetual futures on Hyperliquid. Clients can cross-margin real-world-asset swap exposures and use RLUSD as collateral, subject to jurisdictional availability.
Digital Currency Trader Doctor Profit sees further upside for Bitcoin (BTC), with the 50-day average providing support.