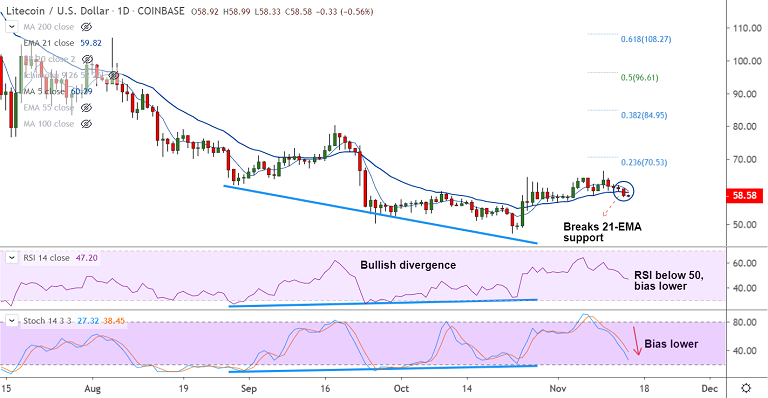
LTC/USD chart - Trading View
Exchange - Coinbase
Support: 57.33 (50-DMA); Resistance: 60.29 (5-DMA)
Technical Analysis: Bias strongly bearish
LTC/USD is extending weakness for the 5th straight session, bias is strongly bearish.
The pair was trading 0.58% lower on the day at 58.57 at 05:10 GMT after closing 3.17% lower in the previous session.
Technical studies support weakness. Stochs and RSI are sharply lower and RSI is below the 50 mark.
MACD shows bearish crossover on signal line. Volatility is still low. GMMA shows bearish shift in near-term trend.
Next major support lies at 50-DMA at 57.33. Break below will see drag lower. Dip till 50.25 (Sept 26 low) likely.
21-EMA is now immediate resistance at 59.81. Break above 55-EMA (61.10) negates near-term bearishness.