


 ETHUSD Bullish Momentum: Follows BTC Above All EMAs, Buy Dips Near $1750 Targeting $2300
  FxWirePro: GBP/USD hits one-month high, scope for further upside
  AUDJPY Extremely Bullish Above 113: Strong AUD Fuels Fresh Rally – Buy Dips at 113 Targeting 115
  Crypto Major Pair Action Bias: ETHUSD Bullish as BTCUSD, SOLUSD & XRPUSD Stay Neutral
  JPY Action Bias: Extremely Bullish Surge Ignites Across NZD, GBP & AUD
  FxWirePro: NZD/USD trades in narrow range ,outlook bullish
  EUR/USD Holds Bullish Tone Despite Pullback from Yesterday’s High
  FxWirePro: NZD/USD steadies around 0.5830,retains bid tone


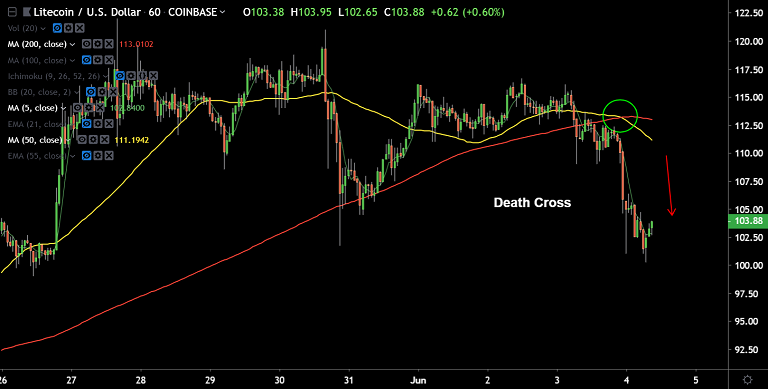
LTC/USD chart - Trading View
Exchange - Coinbase
Support: 98.44 (23.6% Fib); Resistance: 110.57 (5-DMA)
Technical Analysis: Bias Bearish
LTC/USD tests 21-EMA, hits 2-week lows at 100.25 before paring some losses.
Doji formation on the previous weeks candle raises scope for downside.
Stochs and RSI have rolled over from overbought levels, bias lower.
MACD is showing a bearish crossover on signal line. -ve DMI crossover on +ve DMI.
'Death Cross' formation on the hourly charts adds to the bearish bias.
Close below 21-EMA will see dip till 83.10 (channel base). Failure to close below 21-EMA will see consolidation.
For details on FxWirePro's Currency Strength Index, visit http://www.fxwirepro.com/currencyindex.


