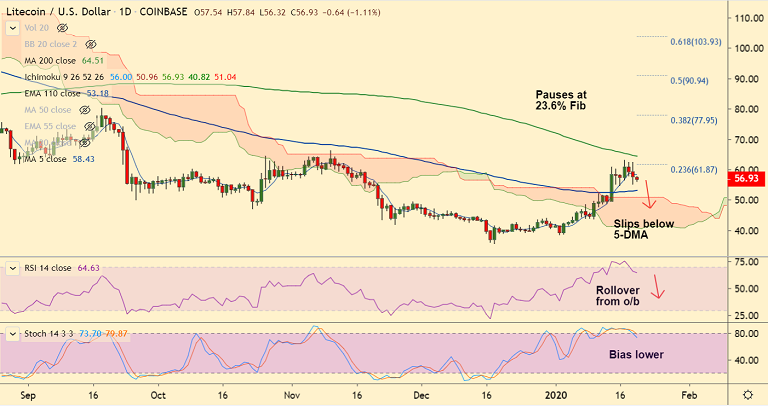
LTC/USD chart - Trading View
Exchange - Coinbase
Technical Analysis: Bias Neutral
Support: 56.20 (200H MA); Resistance: 58.40 (5-DMA)
LTC/USD trades weaker for the 3rd consecutive session, slips below 5-DMA, bias is turning bearish.
The pair was trading 1.23% lower at 56.86 at around 10:45 GMT, after closing 2.88% lower in the previous session.
Price action has slipped below 5-DMA, technical indicators are turning bearish.
Stochs and RSI have turned and are on verge of rollover from overbought levels.
200H MA is offering strong support (currently at 56.20). The pair is extending sideways.
Break below 200H MA will see further weakness. Dip till 110-EMA at 53.17 then likely.



ETH Cracks $2,100 in Bitcoin’s Wake as Bearish EMA Stack Deepens; Sellers Target $1,900 on Rallies
FxWirePro: GBP/NZD slide extends ,eyes 2.2600 level
USD/CHF Smashes Higher to 0.7899 on Dollar Dominance—Bulls Bet on 0.7865 Dips for 0.8000 Breakout
FxWirePro: NZD/USD gains as hawkish RBNZ comments boost Kiwi dollar
FxWirePro- Major Crypto levels and bias summary
Bitcoin Cracks $75K as $1.3B ETF Exodus and Middle East Jitters Spook Bulls; Bears Eye $70K
Bitcoin Bleeds $704M in ETF Outflows as Institutional Exodus Accelerates
FxWirePro- Major Crypto levels and bias summary
Bitcoin Buckles at $73,500: Middle East Tensions and Weak Institutional Demand Set Bearish EMA Stack on $70K Collision Course
FxWirePro: USD/CAD slips as Canadian dollar firms on hopes for US-Iran ceasefire deal 


