
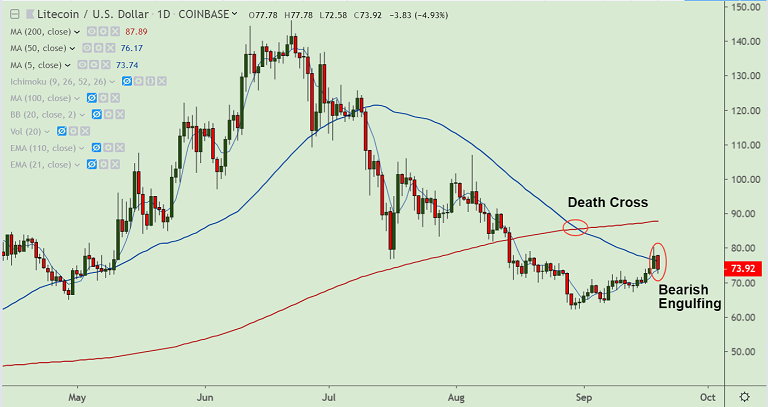
LTC/USD chart - Trading View
Exchange - Coinbase
Support: 71.72 (21-EMA); Resistance: 78.10 (55-EMA)
Technical Analysis: Bias turning bearish
LTC/USD was trading 4.95% lower on the day at 73.90 at 07:55 GMT, bias is turning bearish.
The pair is struggling to break past stiff resistance at 55-EMA at 78.09, 'Death Cross' keeps upside limited.
Price action is on track to form a 'Bearish Engulfing' pattern on the daily chart which might plummet prices.
Further, oscillators are in overbought territory, ripe for roll-back into neutral zone.
Major trend is bearish and Stochastics RSI is also at highly overbought levels.
21-EMA is immediate support at 71.70, break below will see dip till lower Bollinger band at 63.09.
On the flipside, breakout above 55-EMA (78.10) required for upside continuation.


